CALGARY, Feb. 11, 2016 /CNW/ – Cenovus Energy Inc. (TSX: CVE) (NYSE: CVE) achieved significant sustainable cost savings across its business in 2015 and further strengthened what is now one of the best balance sheets in the North American exploration and production sector. The company is planning additional measures in 2016 to help it remain financially resilient through another year of expected low crude oil and natural gas prices. These measures include reducing 2016 capital, operating and general and administrative (G&A) spending by another $400 million to $500 million.
Planned 2016 measures to maintain financial resilience
- Reduce planned capital spending by $200 million to $300 million to between $1.2 billion and $1.3 billion
- Decrease operating and G&A expenses, including workforce costs, by $200 million
- Reduce first quarter dividend by 69% to $0.05 per share
Key 2015 developments
- Exited 2015 with more than $8 billion in liquidity, including cash, cash equivalents and undrawn credit facilities, as well as a net debt to capitalization ratio of 16%
- Cut capital spending by 44% or $1.3 billion compared with 2014
- Achieved better than expected cost savings of approximately $540 million through capital, operating and G&A spending reductions
- Reduced oil sands non-fuel operating costs by 19% to $7.66/barrel (bbl) from 2014
- Reduced workforce by 24% compared with 2014 levels
- Increased 2015 proved reserves by 7% compared with 2014, while decreasing finding and development (F&D) costs by 60% to $5.31/bbl
|
2015 production & financial summary |
||||||||
|
(for the period ended December 31) |
2015 Q4 |
2014 Q4 |
% change |
2015 Full Year |
2014 Full Year |
% change |
||
|
Production (before royalties) |
||||||||
|
Oil sands (bbls/d) |
139,413 |
142,213 |
-2 |
140,320 |
128,195 |
9 |
||
|
Conventional oil1 (bbls/d) |
60,143 |
73,964 |
-19 |
66,627 |
75,298 |
-12 |
||
|
Total oil (bbls/d) |
199,556 |
216,177 |
-8 |
206,947 |
203,493 |
2 |
||
|
Natural gas (MMcf/d) |
424 |
479 |
-11 |
441 |
488 |
-10 |
||
|
Financial ($ millions, except per share amounts) |
||||||||
|
Cash flow2 |
275 |
401 |
-31 |
1,691 |
3,479 |
-51 |
||
|
Per share diluted |
0.33 |
0.53 |
2.07 |
4.59 |
||||
|
Operating earnings2 |
-438 |
-590 |
-403 |
633 |
-164 |
|||
|
Per share diluted |
-0.53 |
-0.78 |
-0.49 |
0.84 |
||||
|
Net earnings |
-641 |
-472 |
618 |
744 |
-17 |
|||
|
Per share diluted |
-0.77 |
-0.62 |
0.75 |
0.98 |
||||
|
Capital investment |
428 |
786 |
-46 |
1,714 |
3,051 |
-44 |
||
|
1 |
Includes natural gas liquids (NGLs). |
|
2 |
Cash flow and operating earnings are non-GAAP measures as defined in the Advisory. |
In 2015, Cenovus took a number of decisive steps to improve its financial resilience and further reinforce its balance sheet. These measures have left the company in a strong position to face what it believes will be another challenging year for the energy sector with continued volatility and low commodity prices.
“By focusing on the aspects of our business that are within our control, we ended 2015 in an even stronger competitive position than we started it,” said Brian Ferguson, Cenovus President & Chief Executive Officer. “We must remain focused on maintaining our financial resilience through 2016 and beyond, ensuring that we don’t compromise the balance sheet strength we’ve worked so hard to achieve, so that we are well placed to maximize shareholder value when commodity prices improve.”
Maintaining financial resilience
To help maintain its financial position for the year ahead, Cenovus is taking a number of additional steps. These include reducing planned capital spending by $200 million to $300 million compared with the company’s original 2016 budget released in December. Cenovus now plans to spend between $1.2 billion and $1.3 billion, 27% less than in 2015 and 59% below 2014 levels. The company is also targeting additional operating and G&A cost savings of $200 million in 2016 to match expected activity levels.
Planned capital budget reductions for 2016 include lower spending at Cenovus’s Foster Creek and Christina Lake oil sands operations, its emerging oil sands assets and the company’s conventional oil business. The planned capital spending reductions are expected to have minimal impact on the company’s oilsands production for 2016, which is forecast to remain within guidance, at between 144,000 barrels per day (bbls/d) net and 157,000 bbls/d net. Cenovus plans to continue focused investment in technology development to help drive potential cost efficiencies and improvements in environmental performance.
Cenovus has identified further opportunities to reduce operating and G&A expenses by prioritizing repairs and maintenance and cancelling or deferring non-essential work, including the deferral of a scheduled turnaround at Foster Creek until 2017. The company plans to continue optimizing its processes to help realize greater efficiencies and is working with its suppliers and service providers to find additional opportunities to reduce costs and increase productivity.
In 2016, Cenovus also plans to further reduce its workforce and adjust its discretionary spending and compensation programs while continuing to focus on retaining the core capabilities and expertise needed to execute on its business plan. The company is undertaking a thorough evaluation of all its staffing costs to align total compensation with the current business environment. This includes reassessing benefits, allowances and contractor rates. Cash compensation for Cenovus’s President & Chief Executive Officer as well as the company’s four other highest paid executives was reduced in 2015 and will be reduced further in 2016. These workforce measures are expected to account for approximately 40% of the planned $200 million in 2016 operating and G&A cost savings.
Dividend update
To help preserve Cenovus’s financial resilience during this prolonged period of low oil prices, the company is reducing its dividend by 69% from the fourth quarter of 2015. For the first quarter of 2016, the Board of Directors has declared a dividend of $0.05 per share, payable on March 31, 2016 to common shareholders of record as of March 15, 2016. Based on the February 10, 2016 closing share price on the Toronto Stock Exchange of $13.52, this represents an annualized yield of about 1.5%. Declaration of dividends is at the sole discretion of the Board and will continue to be evaluated on a quarterly basis.
“Capital discipline and balance sheet strength will remain our top priorities in this extremely challenging oil price environment,” said Ferguson. “We now have some of the fiscal and regulatory clarity at the provincial level necessary to make decisions about future growth. However, we still require additional certainty around federal fiscal and regulatory regimes and sustained cost reductions at our operations before committing to restart deferred projects.”
Guidance update
As a result of its planned capital, operating and G&A cost reductions for 2016, Cenovus has updated its guidance for the year. The revised guidance is available at cenovus.com under “Investors.”
2015 overview
Cenovus had a strong operational year in 2015, increasing its oil sands production by 9% and growing its proved reserves by 7% compared with 2014. At the same time, the company achieved its best-ever safety performance with a total recordable injury frequency (TRIF) of 0.39, a 40% improvement from the previous year.
Balance sheet strength
With the proceeds from the sale of its royalty and fee land business in July and a bought-deal common share issuance in March, the company finished 2015 with cash and cash equivalents on its balance sheet of $4.1 billion. Including the cash on hand and $4 billion in undrawn capacity under its committed credit facility, Cenovus has approximately $8 billion in liquidity available today, with no debt maturing until the fourth quarter of 2019. At the end of 2015, the company’s net debt to capitalization ratio was 16% and its net debt to adjusted earnings before interest, taxes, depreciation and amortization (EBITDA) was 1.2 times.
In 2015, Cenovus realized substantial reductions of approximately $540 million in capital, operating and G&A costs. These cost savings were more than twice the $200 million in annual savings the company had originally targeted at the beginning of 2015. Of Cenovus’s 2015 savings, approximately 60% came from operating and G&A cost improvements, while the remaining 40% came from capital cost reductions, primarily due to greater capital efficiency.
Cenovus anticipates approximately 60% of its 2015 cost savings will be sustainable over the long term. The cost reductions included savings related to improved drilling efficiency, optimized scheduling and prioritization of repair and maintenance activities as well as reduced chemical costs and better oil sands waste disposal and handling processes. About one-quarter of Cenovus’s 2015 cost savings were the result of work that has been deferred.
Oil sands growth
Cenovus increased production from its Foster Creek and Christina Lake oil sands projects by 9% in 2015 while significantly reducing per-unit operating costs compared with the previous year. Lower operating costs were the result of decreased natural gas prices, an increase in production volumes and a decrease in facility and well maintenance expenses. Oil sands operating costs declined $3.37/bbl or 25% to $10.13/bbl in 2015. This included a 19% decrease in non-fuel operating costs to $7.66/bbl.
The year-over-year production increase was largely due to the ramp-up of new wells associated with phase F at Foster Creek as well as improved facility performance and the ramp-up of additional sustaining wells at Christina Lake.
With the new production capacity that’s recently come on stream and more nearing completion, Cenovus believes it is well positioned for when commodity prices recover. The recently completed Christina Lake optimization project is expected to ramp up through 2016. Cenovus is now concentrating on delivering its two oil sands expansion projects that are almost complete. The Foster Creek phase G and Christina Lake phase F expansions are on track with first oil from both projects anticipated in the third quarter of 2016. Together, these two expansion projects, plus the Christina Lake optimization, are expected to add approximately 100,000 bbls/d of incremental gross production capacity (50,000 bbls/d net), an increase of about 35% to Cenovus’s current oil sands production capacity.
Financial results
In 2015, the significant decrease in average benchmark commodity prices compared with 2014 resulted in a 50% decrease in Cenovus’s average crude oil sales price and a 33% decline in its average natural gas sales price. This contributed to a more than 40% decrease in the company’s 2015 operating cash flow to $2.4 billion. Upstream operating cash flow was down by nearly 50% to $2.1 billion.
Operating cash flow from refining and marketing grew by almost 80% to $385 million in 2015, primarily due to improved margins on the sale of secondary products such as coke and asphalt, the weakening of the Canadian dollar relative to the U.S. dollar and an increase in average market crack spreads. This was partially offset by higher heavy crude oil feedstock costs relative to the West Texas Intermediate (WTI) benchmark price and higher reported operating costs as a result of exchange rate fluctuation.
Leadership appointments
Cenovus is pleased to announce the hiring of Kieron McFadyen, who will be joining the company as Executive Vice-President & President, Upstream Oil & Gas on April 6. He will be responsible for all of Cenovus’s oil sands and conventional operations. McFadyen most recently held a senior position with a major international integrated oil and gas company. A mechanical engineer by training, he has acquired an impressive breadth of experience in a number of countries and in a variety of roles over his 30-year career.
“We are delighted that Kieron will be joining us,” said Ferguson. “He has a strong technical and operational background, a noteworthy track record of value creation, change leadership and stakeholder management, and will be an excellent addition to the Cenovus Leadership Team.”
2015 and fourth quarter details
Oil sands
Christina Lake
- Production averaged 74,975 bbls/d net in 2015, 9% more than in 2014, due to incremental volumes from additional wells and improved performance of facilities.
- In the fourth quarter, production averaged 75,733 bbls/d net, a 3% increase from the same period in 2014.
- Operating costs were $8.01/bbl in 2015, a decline of 28% from 2014. Non-fuel operating costs were $5.81/bbl, 22% lower than in 2014.
- The steam to oil ratio (SOR), the amount of steam needed to produce a barrel of oil, was 1.7 in 2015, a slight improvement from 1.8 in 2014.
- Netbacks were $15.05/bbl in 2015, down 65% from 2014.
- In December 2015, Cenovus received regulatory approval from the Alberta Energy Regulator for phase H, a potential future expansion that would add 50,000 bbls/d of incremental gross production capacity.
Foster Creek
- Production averaged 65,345 bbls/d net in 2015, 10% higher than in 2014, due to the ramp-up of volumes from phase F and production from new wells. The gain was partially offset by the impact of a forest fire in the second quarter, which decreased production by approximately 2,600 bbls/d net on an annualized basis.
- Operating costs at Foster Creek decreased 23% to $12.60/bbl in 2015. Non-fuel operating costs were $9.80/bbl, an 18% decline from a year earlier.
- The SOR was 2.5 in 2015, an improvement from 2.6 in 2014.
- Netbacks were $11.74/bbl in 2015, a 74% decline from the previous year.
- New reservoir management techniques Cenovus has been working on over the past couple of years to improve wellbore conformance and well productivity at Foster Creek have yielded excellent results. These enhancements, which include downhole instrumentation and optimization work, as well as steam circulation start-up on new pads, have increased wellbore conformance at Foster Creek from between 70% to 75% previously to approximately 90%, similar to Christina Lake. The improved wellbore conformance has accelerated production from more mature wells, which has led to faster declines at those wells, as expected.
- Unrelated to the improved wellbore conformance, Foster Creek had a higher than average percentage of wells down for servicing at the end of 2015. Cenovus usually expects 3% to 4% of its wells to be down at any given time in a field the size of Foster Creek. Approximately 7% of producing well pairs were offline at the end of the year for a variety of reasons, including pump changes, instrumentation, testing of different completions, regular maintenance and some mechanical issues.
- In accordance with the company’s strategy to focus on value-driven production, Cenovus decided in 2015 not to address well outages as quickly as it would have in a higher price environment. To preserve capital, the company also chose in 2015 to defer some planned new well pads. These decisions, combined with the faster declines due to improved wellbore conformance and well productivity, contributed to lower fourth quarter volumes of 63,680 bbls/d net, a 7% decrease from the same period in 2014.
- Cenovus expects to increase its maintenance program to return well outages to normal levels. The company plans to bring on up to seven new well pads in 2016, which is expected to increase volumes through the year. Cenovus anticipates production at Foster Creek to average between 60,000 bbls/d and 65,000 bbls/d net in the first half of 2016 and between 65,000 bbls/d and 70,000 bbls/d net in the second half of the year, exiting 2016 above 70,000 bbls/d net.
- Cenovus is focused on driving its sustaining capital and F&D costs lower. The company believes that better wellbore conformance and well productivity at both Foster Creek and Christina Lake will help reduce these costs by providing Cenovus with the potential to enhance its development strategy through the use of longer horizontal wells and wider spacing. In addition, the company expects that Wedge WellTM technology may not be required between all of its well pairs and going foward would be considered on a case-by-case basis.
Conventional oil
- Total conventional oil production decreased 12% to 66,627 bbls/d in 2015 compared with the previous year, primarily due to a deferral of capital spending, expected natural declines, the sale of non-core assets in 2014 and the divestiture of Cenovus’s royalty and fee land business in 2015. The decline was partially offset by successful horizontal well performance in southern Alberta.
- In the fourth quarter, production decreased 19% to 60,143 bbls/d compared with the same period in 2014.
- Operating costs were $15.78/bbl in 2015, 15% lower than in 2014.
Natural gas
- Natural gas production averaged 441 million cubic feet per day (MMcf/d) in 2015, down 10% from 2014, primarily due to expected natural declines and the company’s 2015 sale of its royalty and fee land business.
- In the fourth quarter, natural gas production declined 11% to 424 MMcf/d, compared with the final quarter of 2014.
- Operating costs fell 2% to $1.20 per thousand cubic feet (Mcf) in 2015 compared with 2014.
Downstream
- Cenovus’s Wood River Refinery in Illinois and Borger Refinery in Texas, which are jointly owned with the operator, Phillips 66, had continued strong performance in 2015. This included:
- processing a combined average of 419,000 bbls/d gross of crude oil (91% utilization), compared with 423,000 bbls/d gross in 2014
- processing an average of 200,000 bbls/d gross of heavy oil compared with 199,000 bbls/d gross in 2014
- producing an average of 444,000 bbls/d gross of refined products, little changed from 445,000 bbls/d gross a year earlier.
- Refinery operating results from the fourth quarter of 2015 included:
- processing a combined average of 405,000 bbls/d gross of crude oil (88% utilization), compared with 420,000 bbls/d gross in the same period in 2014
- processing an average of 196,000 bbls/d gross of heavy oil compared with 179,000 bbls/d gross in the year-earlier period
- producing an average of 430,000 bbls/d gross of refined products, compared with 442,000 bbls/d gross a year earlier.
- Operating cash flow from refining and marketing was $385 million in 2015, up from $215 million the previous year. This includes a $15 million inventory write-down, compared with a write-down of $113 million in 2014. Cenovus’s refining operating cash flow is calculated on a first-in, first-out (FIFO) inventory accounting basis. Using the last-in, first-out (LIFO) accounting method employed by most U.S. refiners, Cenovus’s operating cash flow from refining would have been $52 million higher in 2015, compared with $101 million higher in 2014.
Financial
Corporate and financial information
- Total cash flow decreased by 51% to nearly $1.7 billion, primarily due to lower crude oil and natural gas sales prices.
- Operating cash flow was $2.4 billion in 2015, down 42% from 2014, largely due to lower crude oil and natural gas sales prices and a decline in natural gas sales volumes. The decrease was partially offset by realized risk management gains of $613 million, excluding refining and marketing, as well as lower royalties and reduced operating expenses.
- In 2015, Cenovus had capital spending of approximately $1.7 billion, nearly 70% of which was directed towards its oil sands assets. Total capital spending for the year was down 44%, or $1.3 billion, from 2014 and was approximately $150 million below the company’s guidance for 2015.
- In 2015, Cenovus invested nearly $1.2 billion in its oil sands assets, 40% lower than in 2014. Investment in conventional oil and natural gas was $245 million, 71% lower than the previous year, while refining and marketing investment was $248 million, a 52% increase. The company also invested $37 million in corporate assets, a 40% decline from 2014.
- For the year, operating cash flow in excess of capital invested was $452 million from the company’s conventional oil business, $293 million from natural gas and $137 million from refining and marketing. Capital investment in Cenovus’s oil sands business exceeded operating cash flow by $138 million.
- In 2015 Cenovus recorded inventory write-downs and asset impairments of $404 million, compared with $779 million in 2014. The 2015 impairments included a $184 million property, plant and equipment impairment charge related to the company’s conventional assets in northern Alberta. The company also recorded exploration expense of approximately $138 million for oil sands and conventional properties deemed not to be commercially viable or technically feasible as well as $66 million in inventory write-downs due to the decline in forward commodity prices.
- After investing approximately $1.7 billion in 2015, Cenovus had a free cash flow shortfall of $23 million compared with free cash flow of $428 million in 2014.
- Net income fell 17% to $618 million in 2015. The decrease was primarily due to a decline in operating earnings, unrealized foreign exchange losses on the company’s U.S.-dollar denominated debt of $1.1 billion and unrealized risk management losses of $195 million compared with gains in 2014. The decrease was offset by an after-tax gain of approximately $1.9 billion from the divestiture of its royalty and fee land business and a deferred tax recovery compared with an expense in 2014.
- G&A expenses were $335 million in 2015, 12% lower than in 2014. The decrease was primarily due to workforce reductions and lower employee long-term incentive costs driven by the decline in the company’s share price. Lower discretionary spending also contributed to the decrease, partially offset by severance costs of $43 million.
- At December 31, 2015, the company’s net debt to capitalization ratio was 16% and net debt to adjusted EBITDA was 1.2 times. The debt to capitalization ratio was 34% and debt to adjusted EBITDA was 3.1 times. Over the long term, Cenovus continues to target a debt to capitalization ratio of between 30% and 40% and a debt to adjusted EBITDA ratio of between 1.0 and 2.0 times. The company expects these ratios may be outside of the target ranges at different points in the economic cycle.
Commodity price hedging
- Cenovus had realized after-tax hedging gains of $481 million in 2015, as the company’s contract prices exceeded average benchmark prices. The company had unrealized after-tax hedging losses of $141 million in 2015.
- From mid-December 2015 through January 2016, Cenovus added 29,000 bbls/d of Brent fixed-price contracts for the first half of 2016 at an average price of US$39.48/bbl and 10,000 bbls/d of WTI fixed-price contracts for the second half of the year at an average price of US$39.02/bbl. As of January 31, 2016, the company had approximately 24% of its oil production hedged for the remainder of the year at a volume-weighted average floor price of about C$72.31/bbl.
- Including hedging, market access commitments and downstream integration largely provided by the company’s two U.S. refineries, Cenovus has positioned itself to mitigate the impact of swings in the Canadian light-heavy oil price differential for more than 85% of its anticipated 2016 heavy oil production. Together, these mechanisms help to support Cenovus’s financial resilience during this challenging period for the industry.
Reserves and resources
All of Cenovus’s reserves and resources are evaluated each year by independent qualified reserves evaluators (IQREs).
- At year-end 2015, Cenovus had total proved reserves of approximately 2.5 billion BOE, an increase of 7%, or 167 million BOE, compared with 2014.
- Proved bitumen reserves for 2015 rose 11% compared with 2014 to approximately 2.2 billion barrels, while proved plus probable bitumen reserves remained unchanged at approximately 3.3 billion barrels. The increase in proved bitumen reserves was primarily due to Christina Lake proved reserves additions of 234 million barrels from improved reservoir performance and the regulatory approval of the Kirby East area expansion, which converted probable reserves to proved reserves.
- Bitumen best estimate economic contingent resources remained unchanged at 9.3 billion barrels compared with 2014.
- Cenovus’s 2015 proved reserves F&D costs, excluding changes in future development costs, were $5.31/BOE, down 60% from $13.39/BOE in 2014, due to reduced capital spending and higher proved reserves additions in 2015. Three-year average F&D costs were $10.56/BOE, excluding changes in future development costs. The 2015 recycle ratio was 2.7 times.
- More details about Cenovus’s reserves and contingent resources are available under Oil and Gas Information in the Advisory. Further information about the company’s reserves is also available in Cenovus’s Annual Information Form (AIF), while additional details about its resources can be found in the supplemental Statement of Contingent and Prospective Resources. These documents are available on SEDAR at sedar.com, EDGAR at sec.gov and on Cenovus’s website at cenovus.com.
Recognitions
- In 2015, Cenovus was again recognized as a global leader in sustainable development through its inclusion in the Dow Jones Sustainability North America Index for the sixth consecutive year and the Dow Jones Sustainability World Index for the fourth consecutive year. The company was also listed on the CDP Canada 200 Climate Disclosure Leadership Index for the sixth consecutive year.
- Cenovus was also recently included, for the third year in a row, in the RobecoSAM Sustainability Yearbook. The publication lists the world’s most sustainable companies in each industry as determined by their score in the RobecoSAM annual Corporate Sustainability Assessment, the same assessment used to create the Dow Jones Sustainability Index Series.
|
Conference Call Today |
|
Cenovus will host a conference call today, February 11, 2016, starting at 9 a.m. MT (11 a.m. ET). To participate, please dial 888-231-8191 (toll-free in North America) or 647-427-7450 approximately 10 minutes prior to the conference call. A live audio webcast of the conference call will also be available via cenovus.com. The webcast will be archived for approximately 90 days. |
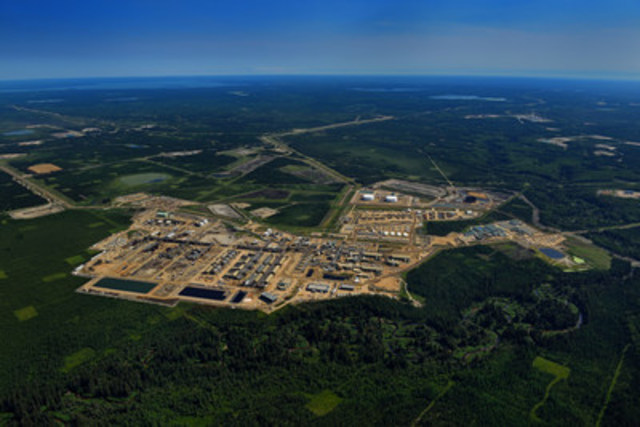
 to produce oil, which involves drilling into the reservoir and injecting steam at a low pressure to soften the oil so it can be pumped to the surface. (CNW Group/Cenovus Energy Inc.)")
