TSX Venture Exchange: PRY
CALGARY, Nov. 27, 2013 /CNW/ – Pinecrest Energy Inc. (“Pinecrest” or the “Company”) announces that it has filed on SEDAR its unaudited financial statements and related Management’s Discussion and Analysis (“MD&A”) for the three and nine months ended September 30, 2013. The statements will be available for review at www.sedar.com or www.pinecrestenergy.com.
THIRD QUARTER 2013 HIGHLIGHTS
The following update highlights operational matters undertaken by Pinecrest during the three months ended September 30, 2013:
FINANCIAL AND OPERATIONAL HIGHLIGHTS
| September 30 | Three months ended | Nine months ended | |||
| 2013 | 2012 | 2013 | 2012 | ||
| FINANCIAL | |||||
| Petroleum and natural gas sales | 25,921 | 21,006 | 89,323 | 71,623 | |
| Funds flow from operations, before realized derivative financial instrument gains or losses (1) |
13,574 | 14,068 | 53,069 | 50,307 | |
| Funds flow from operations (1) | 9,582 | 14,975 | 47,336 | 51,116 | |
| Per share – basic | $0.04 | $0.07 | $0.22 | $0.24 | |
| Per share – diluted | $0.04 | $0.06 | $0.21 | $0.21 | |
| Net income (loss) | (843) | 4,578 | 7,069 | 19,602 | |
| Per share – basic | $0.00 | $0.02 | $0.03 | $0.09 | |
| Per share – diluted | $0.00 | $0.02 | $0.03 | $0.08 | |
| Capital expenditures | 23,886 | 56,979 | 79,761 | 132,480 | |
| Net debt and working capital deficit (2) | (128,617) | (51,489) | (128,617) | (51,489) | |
| Common Shares Outstanding | |||||
| Weighted average – basic | 217,375 | 214,289 | 215,730 | 209,197 | |
| Weighted average – diluted | 217,375 | 239,594 | 228,203 | 237,984 | |
| OPERATING | |||||
| Number of days | 92 | 92 | 273 | 274 | |
| Production | |||||
| Crude oil (bbls/d) | 2,674 | 2,730 | 3,457 | 3,002 | |
| Natural gas (mcf/d) | 463 | 65 | 433 | 51 | |
| NGL (bbls/d) | 53 | 7 | 43 | 7 | |
| Barrels of oil equivalent (boe/d-6:1) | 2,804 | 2,748 | 3,572 | 3,018 | |
| Average realized price (3) | |||||
| Crude oil ($/bbl) | 103.90 | 83.50 | 93.66 | 86.91 | |
| Natural gas ($/mcf) | 2.52 | 1.98 | 2.97 | 1.86 | |
| NGL ($/bbl) | 51.54 | 35.09 | 48.91 | 52.10 | |
| Netback per boe ($)(1) | |||||
| Petroleum and natural gas sales | 100.46 | 83.09 | 91.59 | 86.61 | |
| Royalties | (10.86) | (6.67) | (7.78) | (6.67) | |
| Production and transportation expenses | (29.06) | (15.68) | (22.74) | (14.80) | |
| Field netback | 60.54 | 60.74 | 61.07 | 65.14 | |
| Realized gain (loss) on derivative financial instruments | (15.46) | 3.59 | (5.88) | 0.98 | |
| Operating netback | 45.08 | 64.33 | 55.19 | 66.12 | |
| Wells drilled | |||||
| Gross | 3.0 | 13.0 | 15.0 | 23.0 | |
| Net | 3.0 | 12.8 | 14.3 | 22.5 | |
| Success rate (%) | 100 | 100 | 100 | 100 | |
| (1) | Non-GAAP measure |
| (2) | Net debt and working capital if defined as current assets minus current liabilities, plus outstanding debt, excluding derivative financial instruments |
| (3) | Before the effects of derivative financial instruments |
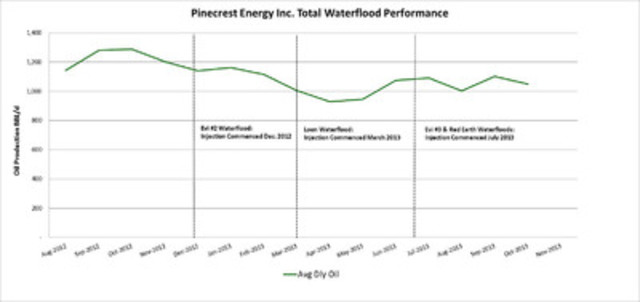
WATERFLOOD UPDATE
During 2013, the Company has continued to focus its efforts on establishing a sustainable and predictable low decline light oil production base through the implementation of seven operated waterflood projects. During the quarter, seven wells producing approximately 260 barrels per day of oil were shut in and converted to water injectors for the Otter Projects #1, #2 and #3. These three projects are more than double the size of the initial four schemes and are forecast to provide a meaningful impact to the Company’s production profile. Production response on these new projects is anticipated in Q1 2014. Pinecrest currently has over one third of its production being pressure maintained by waterflooding and as reservoir pressures rise and volumes increase as projected, this production base is expected to grow to approximately fifty percent of corporate production by early Q2 2014.
The Company continues to see encouraging results from the four previously announced operated waterflood schemes, Evi Project #2 (December 2012), Loon Project #1 (March 2013), Evi Project #3 (July 2013) and Red Earth Project #1 (July 2013). Response times and production increases for these schemes are within Company expectations. Wells in areas downspaced to eight wells per section have been the first to experience the effect of re-pressurization, resulting in quicker production increases than those spaced at four wells per section. The Company anticipates further gains in production rates from these and future Pinecrest operated schemes in the Greater Red Earth area. Pinecrest’s active waterflood count is now comprised of eight projects and the Company has applied for an additional four schemes for implementation in 2014.
All schemes have been on continuous injection since start-up with voidage replacement ratios (VRR) monitored and adjusted continuously as fluid production from the schemes steadily increases. Excluding the August battery turnaround, offsetting producing wells in all schemes have been on continuous production with the exception of Evi Project #2, in which a routine bottomhole pump failure occurred during breakup causing the offsetting producing well to be down for 27 days which also necessitated an injection rate reduction.
The following chart shows the shallowing impact of pressure maintenance on the Company’s waterflood production profile for the period September 2012 to October 2013. Additionally, the Company anticipates this production to increase as the balance of the 2013 waterfloods respond.
OPERATIONS UPDATE
Wet weather delayed the implementation of the Company’s third quarter capital program and caused an increase in unscheduled downtime due to difficult field conditions. During the third quarter, the Company drilled three wells and completed two of these wells. The average cost to drill, complete and equip the wells drilled in the quarter was $3.4 million per well, a $2.3 million per well savings as compared to the first half of 2012.
Operating costs were also negatively impacted by the operating conditions (lease repair and road maintenance). Additionally, the initial start-up phase of the waterflood schemes caused an increase in operating costs. Initially, water and power for the injection facilities is supplied via temporary means. Water is trucked to each site and power is supplied using rental generators and diesel fuel. Pinecrest has completed the field electrification at the Red Earth and Loon fields which will reduce costs. Injection water is now being delivered by pipeline to all but one of the Company’s injection schemes, eliminating significant trucking costs. In addition, costs associated with emulsion trucking have been reduced as the majority of the wells have now been tied into central production facilities.
The Company expects that these initiatives and others currently being implemented will have a positive impact on lowering the Company’s overall operating costs.
For the balance of 2013, Pinecrest is targeting total operatingexpenses (productionand transportation costs) of approximately $23.00 per boe. The implementation of all of Pinecrest’s operating cost initiatives will not be fully realized until Q1 2014.
Current production is approximately 2,650 boed, with approximately 350 boed shut in due to field conditions. For the balance of the year the company expects to invest minimal capital as it awaits the response of its waterfloods.
OUTLOOK – GREATER RED EARTH AREA, ALBERTA
Pinecrest commenced operations in early 2011 with a minimal production base and has organically grown the Company, almost exclusively, through the drill bit by way of an aggressive capital program focused on the large oil in place Slave Point formation in the Greater Red Earth area. As a result, the corporate decline rate has, at times, mimicked that of a horizontal Slave Point oil well. On average, a Slave Point horizontal oil well will experience a first year natural decline of approximately 65% to 70%, which is typical for all tight oil reservoirs. With the licensing and implementation of the seven operated waterfloods, the Company has now transitioned from a high decline production base dominated by newly drilled horizontal wells to a more stable, lower decline asset base. Pinecrest entered 2013 with an estimated annualized monthly decline rate of approximately 55% compared to an estimated current decline rate of 32%. It is expected that this overall decline rate will continue to abate as the full effect and benefit of the Company’s waterflood initiatives occurs over the coming months.
This reduction in corporate decline rates combined with improving capital efficiencies and a focus on operating cost reductions, is projected to grow production while spending significantly less capital in the upcoming years. With the anticipated response of the remaining four operated 2013 waterfloods, the Company expects to generate cash flow in excess of capital requirements in 2014.
Advisory
The information in this press release contains certain forward-looking statements. These statements relate to future events or our future performance. All statements other than statements of historical fact may be forward-looking statements. Forward-looking statements are often, but not always, identified by the use of words such as “seek”, “anticipate”, “plan”, “continue”, “estimate”, “expect”, “may”, “will”, “project”, “predict”, “potential”, “targeting”, “intend”, “could”, “might”, “should”, “believe”, “would” and similar expressions. In particular, forward looking statements in this press release includes, but is not limited to: Pinecrest’s capital program and 2013 business objectives, Pinecrest’s 2013 budget, oil recovery rates, the effects of waterfloods on recovery factors, the potential success of waterfloods in the Slave Point area, decline rates and type curves for wells, production rates, effect of operations initiatives, timing for implementation of operating cost initiatives, exit rates for production and bank debt, downspacing opportunities, the quantity of reserves, and projections of market prices and costs. These statements involve substantial known and unknown risks and uncertainties, certain of which are beyond Pinecrest’s control, including: the impact of general economic conditions; industry conditions; regulatory approvals and permits; changes in laws and regulations including the adoption of new environmental laws and regulations and changes in how they are interpreted and enforced; fluctuations in commodity prices and foreign exchange and interest rates; stock market volatility and market valuations; volatility in market prices for oil and natural gas; liabilities inherent in oil and natural gas operations; uncertainties associated with estimating oil and natural gas reserves; competition for, among other things, capital, acquisitions, of reserves, undeveloped lands and skilled personnel; incorrect assessments of the value of acquisitions; changes in income tax laws or changes in tax laws and incentive programs relating to the oil and gas industry; geological, technical, drilling and processing problems and other difficulties in producing petroleum reserves. Pinecrest’s actual results, performance or achievement could differ materially from those expressed in, or implied by, such forward-looking statements and, accordingly, no assurances can be given that any of the events anticipated by the forward-looking statements will transpire or occur or, if any of them do, what benefits that Pinecrest will derive from them. Except as required by law, Pinecrest undertakes no obligation to publicly update or revise any forward-looking statements.
Statements relating to “reserves” or “resources” are deemed to be forward-looking statements, as they involve the implied assessment, based on certain estimates and assumptions, that the resources or reserves described can be profitably produced in the future.
The Corporation uses the following terms for measurement within this press release that do not have a standardized prescribed meaning under GAAP and these measurements may differ from other companies and accordingly may not be comparable to measures used by other companies. The terms “funds from operations” and “operating netback” are not recognized measures under the applicable GAAP. Management of the Corporation believes that these terms are useful, in addition to profit and loss and cash flow from operating activities as defined by GAAP, for evaluating the Corporation’s operating performance and leverage. Funds from operations is expressed as cash flow from operating activities before changes in non-cash working capital and asset retirement expenditures. Operating netback is a measure of operating margin used in capital allocation decisions. Pinecrest defines operating netback as average realized price per BOE, less royalties per BOE, less operating and transportation expenses per BOE, plus any realized gain or loss per BOE on financial instruments.
Certain information provided in this press release in relation to the results of waterflooding Slave Point reservoirs on lands in close proximity to the land in which the Company has an interest, is considered analogous information under National Instrument 51-101 – Standards of Disclosure for Oil and Gas Activities. Such information is based on publicly available information from governmental agencies and other industry producers and has been provided to give an indication of possible incremental recovery factors in the specified area. Other than comparing such information to the Company’s own limited results in the specified area, the Company has not independently confirmed the accuracy of this information. There is no certainty that such incremental recovery factors will be obtained of even if so obtained, whether such factors can be achieved on an economic basis.
Barrels of Oil Equivalent (“boe”) may be misleading, particularly if used in isolation. A boe conversion ratio of 6MCF:1bbl is based on an energy equivalency conversion method primarily applicable at the burner tip and does not represent a value equivalency at the wellhead. Given that the value ratio based on the current price of crude oil as compared to natural gas is significantly different from the energy equivalency of 6:1,utilizing a conversion on a 6:1 basis may be misleading as an indication of value.
Neither the TSX Venture Exchange nor its Regulation Services Provider (as that term is defined in the policies of the TSX Venture Exchange) accepts responsibility for the adequacy or accuracy of this news release.
SOURCE Pinecrest Energy Inc.
Image with caption: “Pinecrest Energy Inc. Total Waterflood Performance (CNW Group/Pinecrest Energy Inc.)”. Image available at: http://photos.newswire.ca/images/download/20131127_C5698_PHOTO_EN_33983.jpg
Pinecrest Energy Inc.
Suite 500, 255 – 5th Avenue S.W.
Calgary, Alberta T2P 3G6
Wade Becker, President and CEO
or
Dan Toews, V.P. Finance & CFO
Tel: (403) 817-2550 or
Fax: (403) 817-2599