Company generates nearly $1 billion in cash flow
“Increasing production volumes and reliable performance at our oil sands projects helped drive strong cash flow in the third quarter,” said Brian Ferguson, Cenovus President & Chief Executive Officer. “We continue to execute our business plan and remain focused on delivering growing total shareholder return.”
|
Production & financial summary |
||||||||
|
(for the period ended September 30) Production (before royalties) |
2014 Q3 |
2013 Q3 |
% change |
|||||
|
Oil sands total (bbls/d) |
125,089 |
101,824 |
23 |
|||||
|
Conventional oil1 (bbls/d) |
74,000 |
75,114 |
-1 |
|||||
|
Total oil (bbls/d) |
199,089 |
176,938 |
13 |
|||||
|
Natural gas (MMcf/d) |
489 |
523 |
-7 |
|||||
|
Financial ($ millions, except per share amounts) |
||||||||
|
Cash flow2 |
985 |
932 |
||||||
|
Per share diluted |
1.30 |
1.23 |
6 |
|||||
|
Operating earnings2 |
372 |
313 |
19 |
|||||
|
Per share diluted |
0.49 |
0.41 |
||||||
|
Net earnings |
354 |
370 |
-4 |
|||||
|
Per share diluted |
0.47 |
0.49 |
||||||
|
Capital investment |
750 |
743 |
1 |
|||||
|
1 |
Includes natural gas liquids (NGLs) and Pelican Lake production. |
|
2 |
Cash flow and operating earnings are non-GAAP measures as defined in the Advisory. See also the earnings reconciliation summary in the operating earnings table. |
CALGARY, Oct. 23, 2014 /CNW/ – Cenovus Energy Inc. (TSX: CVE) (NYSE: CVE) achieved higher third quarter cash flow compared with the same period a year earlier due to increased production volumes from its oil sands operations, higher natural gas prices and lower finance costs. The cash flow increase was partially offset by weaker crude oil prices and lower refined product output at its refineries compared with the same period in 2013.
Production from Cenovus’s jointly owned Christina Lake and Foster Creek oil sands operations averaged more than 250,000 bbls/d gross (125,000 bbls/d net) in the third quarter, up 23% from a year earlier. Christina Lake production increased 30% from the third quarter of 2013, averaging more than 68,000 bbls/d, net to Cenovus, after expansion phase E reached design capacity earlier in the year. Production was also higher during the quarter due to improved facility performance.
Foster Creek production averaged almost 57,000 bbls/d net in the third quarter, up 15% from the same period a year earlier, partially due to an increase in the number of producing wells using Wedge WellTM technology. Performance also improved as a result of the elimination of a backlog of well maintenance and the company’s continued focus on preventative work and subsurface monitoring. In addition, a small-scale planned turnaround in the third quarter had less of an impact on production as compared to a major planned turnaround in the same period of 2013. First production from the phase F wells began in September. Phase F adds 30,000 bbls/d of gross capacity.
“We’re pleased about the return to reliable performance at Foster Creek and the continued strong operations at Christina Lake as we remain focused on achieving plant utilization rates of between 90% and 95%,” said John Brannan, Executive Vice-President & Chief Operating Officer. “We’re delivering solid, predictable growth at our oil sands projects and with the completion of phase F we expect to add incremental production over the next 18 months.”
Cash flow was almost $1 billion in the third quarter, up 6% from the same period a year earlier. The increase was driven by higher operating cash flow from the company’s oil sands and natural gas assets, reflecting increased production volumes at Christina Lake and Foster Creek and higher natural gas prices, as well as lower finance costs when compared with the third quarter of 2013. All of the company’s business segments generated operating cash flow in excess of capital investment during the quarter. After investing $750 million in committed and growth capital in the third quarter, Cenovus had free cash flow of $235 million, 24% higher than in the same period of 2013.
The increase in upstream operating cash flow was partially offset by a 53% decrease in refining operating cash flow compared with the third quarter of 2013. The decrease in refining operating cash flow was due to lower refined product output after an unplanned coker outage at the Borger Refinery and a planned turnaround that began late in the third quarter at the Wood River Refinery. The decline in refining operating cash flow was partially offset by lower crude oil feedstock costs and higher market crack spreads.
Successful asset sale
On September 30, Cenovus successfully completed the sale of certain of its Wainwright heavy oil assets in east-central Alberta for net proceeds of $234 million, recording a gain of $137 million. Oil production from these assets was approximately 2,800 bbls/d in the third quarter. Cenovus retained ownership of the mineral rights on fee lands that were part of the divestiture and will continue to receive a royalty payment from the new owners on current and future production from these lands.
Recognition for corporate responsibility
In September, Cenovus was named to the Dow Jones Sustainability World Index for the third year in a row. Cenovus is the only North American oil and gas company to make the World Index this year, ranking high in the areas of risk management, transparent reporting and stakeholder engagement. The company was also named to the Dow Jones Sustainability North America Index for the fifth consecutive year.
Guidance updated
Cenovus has updated its 2014 full-year guidance to reflect actual numbers for the first nine months of the year and the company’s estimates for the fourth quarter. Updated guidance can be found at cenovus.com under “Investors”.
2015 budget to be released in December
Cenovus is currently developing its 2015 budget and will provide details during a conference call scheduled for December 11, 2014.
|
Oil Projects |
|||||||||||||||||||
|
Daily production1 |
|||||||||||||||||||
|
(Before royalties) (Mbbls/d) |
2014 |
2013 |
2012 |
||||||||||||||||
|
Q3 |
Q2 |
Q1 |
Full Year |
Q4 |
Q3 |
Q2 |
Q1 |
Full Year |
|||||||||||
|
Oil sands |
|||||||||||||||||||
|
Christina Lake |
68 |
68 |
66 |
49 |
61 |
53 |
38 |
44 |
32 |
||||||||||
|
Foster Creek |
57 |
57 |
55 |
53 |
52 |
49 |
55 |
56 |
58 |
||||||||||
|
Oil sands total |
125 |
125 |
120 |
103 |
114 |
102 |
94 |
100 |
90 |
||||||||||
|
Conventional oil |
|||||||||||||||||||
|
Pelican Lake |
24 |
25 |
25 |
24 |
25 |
25 |
24 |
24 |
23 |
||||||||||
|
Weyburn |
16 |
16 |
16 |
16 |
16 |
16 |
16 |
17 |
16 |
||||||||||
|
Other conventional2 |
34 |
36 |
36 |
36 |
34 |
34 |
37 |
39 |
37 |
||||||||||
|
Conventional total |
74 |
77 |
76 |
77 |
75 |
75 |
77 |
80 |
76 |
||||||||||
|
Total oil |
199 |
202 |
197 |
179 |
189 |
177 |
171 |
180 |
165 |
||||||||||
|
1 |
Totals may not add due to rounding. |
||||||||||||||||||
|
2 |
Includes NGLs production. |
||||||||||||||||||
Oil sands
Cenovus has a substantial portfolio of oil sands assets in northern Alberta with the potential to provide decades of production growth. The two operations currently producing, Foster Creek and Christina Lake, use steam-assisted gravity drainage (SAGD), which involves drilling into the reservoir and injecting steam at low pressures to soften the thick oil so it can be pumped to the surface. Cenovus is currently building its third major oil sands project at Narrows Lake, which is part of the Christina Lake Region. These projects are operated by Cenovus and jointly owned with ConocoPhillips. Cenovus has an enormous opportunity to deliver increased shareholder value through production growth from several identified emerging projects and additional future developments. The company continues to assess its resources and prioritize development plans to create long-term value.
Christina Lake
Production
Expansions
Foster Creek
Production
Expansions
Narrows Lake
Emerging projects
Grand Rapids
Telephone Lake
Conventional Oil
Pelican Lake
Cenovus produces heavy oil from the Wabiskaw formation at its 100%-owned Pelican Lake operation in the Greater Pelican Region, about 300 kilometres north of Edmonton. Cenovus has been injecting polymer since 2006 to enhance production from the reservoir, which is also under waterflood.
Other conventional oil
In addition to Pelican Lake, Cenovus has tight oil opportunities in Alberta, as well as the established Weyburn operation in Saskatchewan that uses carbon dioxide injection to enhance oil recovery.
|
Natural Gas |
||||||||||||||||||
|
Daily production |
||||||||||||||||||
|
(Before royalties) (MMcf/d) |
2014 |
2013 |
2012 |
|||||||||||||||
|
Q3 |
Q2 |
Q1 |
Full Year |
Q4 |
Q3 |
Q2 |
Q1 |
Full Year |
||||||||||
|
Natural gas |
489 |
507 |
476 |
529 |
514 |
523 |
536 |
545 |
594 |
|||||||||
Cenovus has a solid base of established, reliable natural gas properties in Alberta. These properties are managed as financial assets, not production assets, generating operating cash flow well in excess of their ongoing capital investment requirements. The natural gas business also acts as an economic hedge against price fluctuations because natural gas fuels the company’s oil sands and refining operations.
Market access
Cenovus is concentrating on finding new customers in North America and around the world and working to ensure it has the ability to move its oil to these customers. The company continues to support proposed pipelines to Canada’s east and west coasts as well as to the U.S. to ensure adequate shipping capacity for its growing production. To complement its pipeline strategy, Cenovus takes a portfolio approach to marketing and transportation that also includes using rail and commodity price hedging.
Refining
Cenovus’s refining operations allow the company to capture value from crude oil production through to refined products such as diesel, gasoline and jet fuel. This integrated strategy provides a natural economic hedge to discounted crude oil prices by providing lower feedstock costs to the Wood River Refinery in Illinois and Borger Refinery in Texas, which Cenovus jointly owns with the operator, Phillips 66.
Financial
Operations
Financial
Dividend
The Cenovus Board of Directors declared a fourth quarter dividend of $0.2662 per share, payable on December 31, 2014 to common shareholders of record as of December 15, 2014. Based on the October 22, 2014 closing share price on the Toronto Stock Exchange of $26.27, this represents an annualized yield of about 4.1%. Declaration of dividends is at the sole discretion of the Board. Cenovus’s continued commitment to a meaningful dividend is an important aspect of its strategy to focus on increasing total shareholder return.
Cash flow, earnings and capital investment
Risk management, G&A expenses and financial ratios
|
Operating earnings1 |
||||
|
(for the period ended September 30) ($ millions, except per share amounts) |
2014 Q3 |
2013 Q3 |
||
|
Earnings, before income tax Add back (deduct): |
533 |
542 |
||
|
Unrealized risk management (gains) losses2 |
(165) |
(8) |
||
|
Non-operating unrealized foreign exchange (gains) losses3 (Gains) losses on divestiture of assets |
253 (137) |
(53) 1 |
||
|
Operating earnings, before income tax |
484 |
482 |
||
|
Income tax expense |
112 |
169 |
||
|
Operating earnings |
372 |
313 |
||
|
1 |
Operating earnings is a non-GAAP measure as defined in the Advisory. |
|
2 |
The unrealized risk management (gains) losses include the reversal of unrealized (gains) losses recognized in prior periods. |
|
3 |
Includes unrealized foreign exchange (gains) losses on translation of U.S. dollar denominated notes issued from Canada and the Partnership Contribution Receivable and foreign exchange (gains) losses on settlement of intercompany transactions. |
|
Conference Call Today |
|
Cenovus will host a conference call today, October 23, 2014, starting at 9 a.m. MT (11 a.m. ET). To participate, please dial 888-231-8191 (toll-free in North America) or 647-427-7450 approximately 10 minutes prior to the conference call. An archived recording of the call will be available from approximately 12 p.m. MT on October 23 until 10 p.m. MT on October 30, 2014, by dialing 855-859-2056 or 416-849-0833 and entering password 93461329. A live audio webcast of the conference call will also be available via cenovus.com. The webcast will be archived for approximately 90 days. |
[expand title=”Advisories & Contact”]ADVISORY
FINANCIAL INFORMATION
Basis of Presentation Cenovus reports financial results in Canadian dollars and presents production volumes on a net to Cenovus before royalties basis, unless otherwise stated. Cenovus prepares its financial statements in accordance with International Financial Reporting Standards (IFRS).
Non-GAAP Measures This news release contains references to non-GAAP measures as follows:
These measures have been described and presented in this news release in order to provide shareholders and potential investors with additional information regarding Cenovus’s liquidity and its ability to generate funds to finance its operations. For further information, refer to Cenovus’s most recent Management’s Discussion and Analysis (MD&A) available at cenovus.com.
OIL AND GAS INFORMATION
Barrels of Oil Equivalent Certain natural gas volumes have been converted to barrels of oil equivalent (BOE) on the basis of six Mcf to one bbl. BOE may be misleading, particularly if used in isolation. A conversion ratio of one bbl to six Mcf is based on an energy equivalency conversion method primarily applicable at the burner tip and does not represent value equivalency at the wellhead.
Netbacks reported in this news release are calculated as set out in the AIF. Heavy oil prices and transportation and blending costs exclude the costs of purchased condensate, which is blended with heavy oil. For the third quarter 2014, the cost of condensate on a per barrel of unblended crude oil basis was as follows: Christina Lake – $42.57 and Foster Creek – $38.50.
FORWARD-LOOKING INFORMATION
This document contains certain forward-looking statements and other information (collectively “forward-looking information”) about our current expectations, estimates and projections, made in light of our experience and perception of historical trends. Forward-looking information in this document is identified by words such as “anticipate”, “believe”, “expect”, “plan”, “forecast” or “F”, “target”, “projected”, “could”, “focus”, “proposed”, “schedule”, “potential”, “may”, “strategy” or similar expressions and includes suggestions of future outcomes, including statements about our growth strategy and related schedules, projections contained in our 2014 guidance, growing total shareholder return, forecast operating and financial results, planned capital expenditures, expected future production, including the timing, stability or growth thereof, expected increase in production capacity through optimization activity and debottlenecking, expected future refining capacity, broadening market access, improving cost structures, potential dividends and dividend growth strategy, anticipated timelines for future regulatory, partner or internal approvals, future impact of regulatory measures, forecasted commodity prices, future use and development of technology, including to reduce our environmental impact and projected increasing shareholder value. Readers are cautioned not to place undue reliance on forward-looking information as our actual results may differ materially from those expressed or implied.
Developing forward-looking information involves reliance on a number of assumptions and consideration of certain risks and uncertainties, some of which are specific to Cenovus and others that apply to the industry generally.
The factors or assumptions on which the forward-looking information is based include: assumptions disclosed in our current guidance, available at cenovus.com; our projected capital investment levels, the flexibility of our capital spending plans and the associated source of funding; estimates of quantities of oil, bitumen, natural gas and liquids from properties and other sources not currently classified as proved; our ability to obtain necessary regulatory and partner approvals; the successful and timely implementation of capital projects or stages thereof; our ability to generate sufficient cash flow from operations to meet our current and future obligations; and other risks and uncertainties described from time to time in the filings we make with securities regulatory authorities.
2014 guidance, updated October 23, 2014 and available at cenovus.com, is based on an average diluted number of shares outstanding of approximately 757 million. It assumes: Brent US$104.00/bbl, WTI of US$97.00/bbl; Western Canada Select of $86.00/bbl; NYMEX of US$4.50/MMBtu; AECO of $4.50/GJ; Chicago 3-2-1 crack spread of US$17.00/bbl; exchange rate of $0.91 US$/C$.
The risk factors and uncertainties that could cause our actual results to differ materially, include: volatility of and assumptions regarding oil and gas prices; the effectiveness of our risk management program, including the impact of derivative financial instruments and the success of our hedging strategies; the accuracy of cost estimates; fluctuations in commodity prices, currency and interest rates; fluctuations in product supply and demand; market competition, including from alternative energy sources; risks inherent in our marketing operations, including credit risks; maintaining desirable ratios of debt to adjusted EBITDA as well as debt to capitalization; our ability to access various sources of debt and equity capital; accuracy of our reserves, resources and future production estimates; our ability to replace and expand oil and gas reserves; our ability to maintain our relationships with our partners and to successfully manage and operate our integrated heavy oil business; reliability of our assets; potential disruption or unexpected technical difficulties in developing new products and manufacturing processes; refining and marketing margins; potential failure of new products to achieve acceptance in the market; unexpected cost increases or technical difficulties in constructing or modifying manufacturing or refining facilities; unexpected difficulties in producing, transporting or refining of crude oil into petroleum and chemical products; risks associated with technology and its application to our business; the timing and the costs of well and pipeline construction; our ability to secure adequate product transportation, including sufficient crude-by-rail or other alternate transportation; changes in the regulatory framework in any of the locations in which we operate, including changes to the regulatory approval process and land-use designations, royalty, tax, environmental, greenhouse gas, carbon and other laws or regulations, or changes to the interpretation of such laws and regulations, as adopted or proposed, the impact thereof and the costs associated with compliance; the expected impact and timing of various accounting pronouncements, rule changes and standards on our business, our financial results and our consolidated financial statements; changes in the general economic, market and business conditions; the political and economic conditions in the countries in which we operate; the occurrence of unexpected events such as war, terrorist threats and the instability resulting therefrom; and risks associated with existing and potential future lawsuits and regulatory actions against us.
Readers are cautioned that the foregoing lists are not exhaustive and are made as at the date hereof. For a full discussion of our material risk factors, see “Risk Factors” in our most recent Annual Information Form/Form 40-F, “Risk Management” in our current and annual MD&A and risk factors described in other documents we file from time to time with securities regulatory authorities, all of which are available on SEDAR at sedar.com, EDGAR at sec.gov and our website at cenovus.com.
TM denotes a trademark of Cenovus Energy Inc.
Cenovus Energy Inc.
Cenovus Energy Inc. is a Canadian integrated oil company. It is committed to applying fresh, progressive thinking to safely and responsibly unlock energy resources the world needs. Operations include oil sands projects in northern Alberta, which use specialized methods to drill and pump the oil to the surface, and established natural gas and oil production in Alberta and Saskatchewan. The company also has 50% ownership in two U.S. refineries. Cenovus shares trade under the symbol CVE, and are listed on the Toronto and New York stock exchanges. Its enterprise value is approximately $25 billion. For more information, visit cenovus.com.
Find Cenovus on Facebook, Twitter, LinkedIn, YouTube and Instagram.
SOURCE Cenovus Energy Inc.
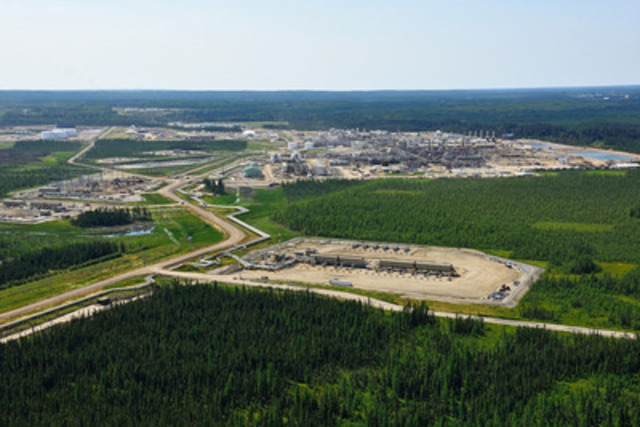
Image with caption: “Cenovus’s Christina Lake project in northern Alberta uses steam-assisted gravity drainage (SAGD) to produce oil. The process involves drilling into the reservoir and injecting steam at a low pressure to soften the oil so it can be pumped to the surface. (CNW Group/Cenovus Energy Inc.)”. Image available at: http://photos.newswire.ca/images/download/20141023_C1035_PHOTO_EN_6992.jpg
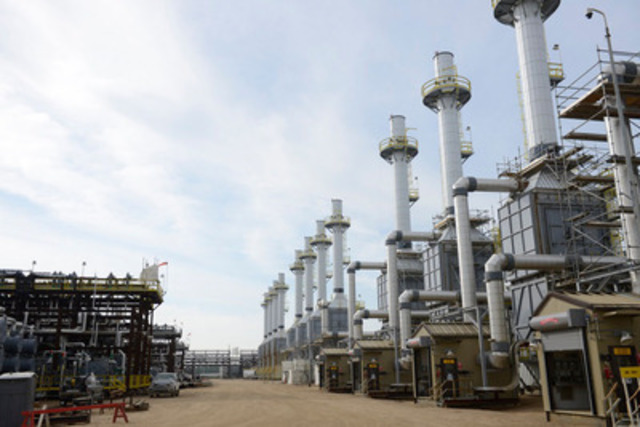
Image with caption: “Steam generators at Cenovus’s Christina Lake project in northern Alberta. The project uses a process called steam-assisted gravity drainage (SAGD) to produce oil, which involves drilling into the reservoir and injecting steam at a low pressure to soften the oil so it can be pumped to the surface. (CNW Group/Cenovus Energy Inc.)”. Image available at: http://photos.newswire.ca/images/download/20141023_C1035_PHOTO_EN_6993.jpg
For further information: CENOVUS CONTACTS: Investor Relations: Susan Grey, Director, Investor Relations, 403-766-4751; Graham Ingram, Senior Analyst, Investor Relations, 403-766-2849; Anna Kozicky, Senior Analyst, Investor Relations, 403-766-4277; Media: Brett Harris, Media Lead, 403-766-3420; Reg Curren, Senior Media Advisor, 403-766-2004; General media line, 403-766-7751[/expand]