Company to focus on high-return projects, capital discipline
CALGARY, Dec. 11, 2014 /CNW/ – Cenovus Energy Inc. (TSX: CVE) (NYSE: CVE) plans to exercise capital restraint in the year ahead in the face of weaker oil prices. The company’s 2015 capital budget focuses on continued profitable investment in oil sands projects, creating near-term cash flow while maintaining flexibility to adjust to shifting market conditions. Cenovus will manage through the volatile oil price environment by:
“Cenovus has strong producing assets, an integrated portfolio, rich development opportunities and a solid balance sheet,” said Brian Ferguson, Cenovus President & Chief Executive Officer. “We’re well positioned to face the challenges ahead in 2015 should the current oil price environment persist. We expect to be able to live within our means while continuing to invest in future production growth. We also anticipate maintaining our dividend at current levels through these difficult times.”
In 2015, Cenovus is planning capital investment of between $2.5 billion and $2.7 billion. The company expects total cash flow for the year of between $2.6 billion and $2.9 billion, based on a West Texas Intermediate (WTI) price of between US$74 per barrel (bbl) and US$81/bbl. The company expects moderate production growth in 2015 of approximately 9% for oil sands production and about 4% for total oil production.
|
Budget forecast1 |
|||
|
2015 budget |
2014 guidance |
% change3 |
|
|
Cash flow2 ($ billions) |
2.6 – 2.9 |
3.8 – 3.9 |
-29 |
|
Per share diluted ($/share) |
3.40 – 3.80 |
5.00 – 5.15 |
|
|
Operating cash flow2 ($ billions) |
3.5 – 4.0 |
4.5 – 4.7 |
-18 |
|
Total capital investment ($ billions) |
2.5 – 2.7 |
3.0 – 3.1 |
-15 |
|
Total oil production (Mbbls/d)4 |
197 – 214 |
198 |
4 |
|
1 |
2015 based on WTI of US$77.00/bbl, a WTI/WCS differential of US$16.50/bbl, NYMEX gas of US$3.95/MMBtu, US$/C$ exchange rate at $0.88 and a Chicago 3-2-1 crack spread of US$15.50/bbl. |
|
2 |
Cash flow and operating cash flow are non-GAAP measures as defined in the Advisory. |
|
3 |
Percentage change based on the midpoints of the ranges. |
|
4 |
Includes NGLs production. |
Investing for the future
Approximately three-quarters of Cenovus’s planned 2015 capital program is for committed capital. This will be used to support current oil sands production, the advancement of expansions already underway at the company’s Foster Creek and Christina Lake assets, the maintenance of existing conventional oil projects and ongoing maintenance and expansion projects at its refining assets. The remaining capital is allocated to discretionary investment, including the advancement of future oil sands assets, further development of the company’s conventional oil opportunities, and technology projects.
In 2015, Cenovus expects to fund its committed capital of approximately $2.1 billion, and its anticipated dividend, with cash flow and expected available cash on hand of between $700 million and $800 million. If WTI prices are in the US$65/bbl range through 2015, Cenovus expects it would still be able to fully fund its committed capital for the year with internal cash flow. The company anticipates discretionary capital for 2015 of between $400 million and $600 million. If the current low oil price environment continues, Cenovus has planned flexibility into its capital program and has identified additional areas where it can make further reductions to keep spending aligned with anticipated cash flows. In the first quarter of 2015, Cenovus will review its capital spending plans and may adjust its budget depending on the outlook for oil prices. As oil sands expansion projects are completed in the coming years, the company expects committed capital to decrease and a higher percentage of that committed capital to go towards sustaining production. In 2016 and 2017, Cenovus anticipates its overall committed capital to decrease to approximately $1.8 billion and $1.7 billion, respectively.
“Capital discipline is at the forefront of our budget considerations as we make plans for the coming years,” said Ferguson. “We have some of the best oil sands assets in the industry but that doesn’t mean we’ll continue to expand them just for the sake of growth. Production must be linked to value creation for our shareholders.”
In 2015, the company expects to invest between $700 million and $750 million at Foster Creek. At Christina Lake, Cenovus anticipates investing between $800 million and $860 million. In light of the current oil price environment, the company has decided to spread capital investment in its oil sands projects over a longer period of time in order to preserve cash. As a result, first production from phases G and H at Foster Creek is expected to be pushed out by one or two quarters. The company expects to bring on these approved expansion phases, including optimization, at a cost of between $35,000 and $38,000 per flowing barrel for phases F, G and H at Foster Creek. Capital efficiencies at Christina Lake phases F, G and H are expected to be between $30,000 and $32,000 per flowing barrel. Starting in late 2015, the planned optimization of the plant at Christina Lake, is anticipated to add 22,000 barrels per day (bbls/d) of gross incremental production capacity at a cost of between $8,000 and $10,000 per flowing barrel. This is expected to improve capital efficiencies for phases F, G and H at Christina Lake, including plant optimization, to between $28,000 and $30,000 per flowing barrel.
To help preserve cash and focus on value creation, Cenovus has also decided to substantially slow its development plans at Narrows Lake, its third oil sands project jointly owned with ConocoPhillips. The company has integrated Narrows Lake under the same management team that operates the nearby Christina Lake project. This will allow existing infrastructure and resources at Christina Lake to support the development of Narrows Lake, eliminating duplication, which is expected to lower overall costs. Cenovus will also take advantage of the slower pace of development at Narrows Lake to assess its engineering and execution strategy to help ensure that the project is developed with the best possible capital efficiencies. Cenovus believes Narrows Lake has the potential to achieve total production capacity of 130,000 bbls/d. In 2015, Cenovus plans to invest between $60 million and $75 million at Narrows Lake.
In 2015, the company expects to reduce spending on its emerging oil sands assets to between $105 million and $115 million. At Telephone Lake, Cenovus has received regulatory approval for a steam-assisted gravity drainage (SAGD) project with initial capacity of 90,000 bbls/d, anticipated to be developed in two phases. The company continues to view Telephone Lake as one of its most strategic future growth assets, with forecasted total production capacity in excess of 300,000 bbls/d. The company expects to make a decision on the timing of development for Telephone Lake in 2015. At Grand Rapids, the company continues to operate a SAGD pilot project with two producing well pairs. Drilling of a third pilot well pair is planned for the first quarter of 2015. Data from these well pairs will help determine the company’s future pace of development for Grand Rapids. The project has regulatory approval for total potential production capacity of 180,000 bbls/d.
During the year, Cenovus plans to invest between $290 million and $330 million in its conventional oil business, excluding Pelican Lake, with most of the investment going towards its tight oil assets. The company has decided to reduce spending at Pelican Lake to between $110 million and $120 million to align its investment plans with the more moderate rates of production growth experienced to date from the project’s polymer flood program and to conserve capital. Cenovus continues to believe in the asset’s potential but expects to develop Pelican Lake over a longer period of time. Investment in the company’s natural gas assets is expected to remain consistent with 2014, at between $30 million and $35 million.
In 2015, Cenovus plans to invest between $225 million and $245 million combined in its Wood River Refinery and Borger Refinery in the U.S., which are jointly owned with the operator, Phillips66. In addition to maintenance, reliability and environmental initiatives, 2015 investment will include initial capital for the debottlenecking project at Wood River.
Given the market’s recent appetite for income-producing properties, Cenovus undertook a thorough analysis of its substantial fee lands portfolio and concluded that there may be attractive opportunities to unlock additional value from them. The company is currently assessing options to maximize value for shareholders from its fee lands and anticipates making a decision on the options in early 2015.
|
Capital investment by asset ($ millions) |
|||
|
2015 Budget |
2014 Guidance |
% change1 |
|
|
Foster Creek |
700 – 750 |
825 – 845 |
-13 |
|
Christina Lake |
800 – 860 |
785 – 805 |
4 |
|
Narrows Lake |
60 – 75 |
185 – 190 |
-64 |
|
Emerging oil sands assets2 |
105 – 115 |
200 – 210 |
-46 |
|
Conventional oil3 |
400 – 450 |
830 – 845 |
-49 |
|
Natural gas |
30 – 35 |
30 – 35 |
– |
|
Refining4 |
225 – 245 |
165 – 175 |
38 |
|
Total capital investment5 |
2,500 – 2,700 |
3,000 – 3,100 |
-15 |
|
1 |
Percentage change based on the midpoints of the ranges. |
|
2 |
Includes Grand Rapids, Telephone Lake and other emerging assets. |
|
3 |
Includes Pelican Lake as well as oil assets in Alberta and Saskatchewan. |
|
4 |
Refining capital investment is reported in C$ but incurred in US$ and, as such, will be impacted by foreign exchange. |
|
5 |
Total capital investment includes additional investment not represented above. |
Cenovus continues to target a debt to capitalization ratio of between 30% and 40% and a debt to adjusted EBITDA ratio of between 1.0 and 2.0 times. In 2015, the company expects its debt to capitalization and debt to adjusted EBITDA ratios to be within these ranges.
Impacts on cash flow
In addition to the impact of lower crude oil prices, Cenovus expects its 2015 cash flow will be negatively impacted by higher cash taxes and transportation costs, somewhat offset by higher oil volumes. Cash tax expense is expected to be significantly higher, mainly because a large portion of the company’s income is earned through a partnership which reports, for cash tax purposes, on a one-year deferred basis. As such, 2015 cash tax expense is expected to reflect tax on higher partnership income earned in 2014, subject to certain adjustments.
Oil transportation costs are expected to be higher in 2015 as a result of longer-term commitments to new pipeline and rail capacity that Cenovus has made to secure additional transportation options for its growing production and to improve its overall market access. Excess capacity commitments on the expanded Cold Lake pipeline system in 2015 are expected to translate into higher per-barrel transportation costs at Foster Creek. In future years, as anticipated new production comes on stream at Foster Creek, Christina Lake and Narrows Lake, this excess capacity is expected to be filled, lowering per-barrel transportation costs.
Newly contracted capacity on the Flanagan South pipeline system, as well as incremental growth in Cenovus’s rail shipping capacity, are also expected to contribute to higher per-barrel transportation costs in 2015. It is anticipated that these additional costs from rail and Flanagan South will be more than offset by the higher pricing Cenovus expects to receive for its oil by using these transportation options.
Cenovus expects operating costs at Foster Creek to average between $15.50/bbl and $18.00/bbl in 2015, about 4% lower than the company’s expected operating costs for 2014. Operating costs at Christina Lake are anticipated to average between $11.75/bbl and $13.75/bbl, about 6% higher than expected 2014 costs due, in part, to increased turnaround activity planned for 2015. Supply costs for planned future capital investment at Christina Lake and Foster Creek, including a 9% return on capital, are estimated at between US$40/bbl and US$45/bbl WTI.
Attacking cost structures
Earlier this year, the company established a formal process to evaluate potential sustainable savings across all of its operations to combat increasing costs. As a result, Cenovus has identified opportunities targeted to achieve between $400 million and $500 million in annual operating and capital cost reductions in the years ahead.
“In order to maintain our competitive advantage, we have made reducing costs a priority with all of our staff,” said Ferguson. “Over the last year or so, our teams have come up with a number of ideas to improve our cost efficiency and we’ve started implementing some of those changes already.”
The company’s cost-savings strategy will focus, in part, on applying a manufacturing approach – simplifying and using the same designs and processes over and over for drilling and field construction – across all of its operations. Cenovus will also continue efforts to take advantage of the scale of its operated spending to help capture additional cost efficiencies in all of its business units. In addition, the company is planning to keep its workforce levels in check, with no new growth expected in 2015.
Should the current weakness in oil prices lead to a continued slowing of growth in the Canadian energy industry, there may be additional opportunities for Cenovus to improve its cost structure in 2015 by taking advantage of reduced competition for labour and materials by locking in lower prices over several years to help improve its capital efficiencies.
Oil sands lead production growth
In the year ahead, Cenovus expects oil sands growth of approximately 11,000 bbls/d net, driven largely by the phase F ramp-up at Foster Creek, offset by an approximate 4,000 bbls/d decline in conventional oil production, partly related to the sale of a portion of the company’s Wainwright heavy oil assets in the third quarter of 2014. As a result, the company expects total oil production to average between 197,000 bbls/d and 214,000 bbls/d net in 2015, approximately 4% higher than its forecast for 2014.
To date, in the fourth quarter of 2014, Christina Lake has experienced strong average oil production rates of approximately 74,000 bbls/d net. Cenovus expects Christina Lake production will average between 67,000 bbls/d and 74,000 bbls/d net throughout 2015. Production in 2015 will be impacted by major turnaround. Optimization of the plant at Christina Lake is expected to add 22,000 bbls/d in gross production capacity at the end of 2015.
Over the last year, Cenovus has taken steps to improve production performance at Foster Creek. The company has improved its downhole instrumentation, enhanced steam distribution across the field, improved wellbore conformance, drilled an additional 42 wells using Wedge WellTM technology, refined well start-up procedures and debottlenecked parts of the plant. As a result of these initiatives, Foster Creek has experienced strong production performance in recent months, some of which is flush production from new wells using Wedge WellTM technology.
To date, in the fourth quarter, the project has had average production of approximately 67,500 bbls/d net, well ahead of the company’s expectations. Cenovus anticipates that some of the incremental production experienced at Foster Creek during the fourth quarter will not be sustained through 2015 due to an anticipated tapering off of the flush production and some natural declines at mature well pads. The company expects Foster Creek will have average production of between 62,000 bbls/d and 68,000 bbls/d net in 2015, 14% higher than the company’s forecast for average daily production for the full year 2014. Phase F continues to ramp up as expected and is anticipated to exit 2014 with production of approximately 3,500 bbls/d net. It is expected to reach full design capacity in early 2016. Cenovus is also taking a more moderate approach to advancing phases G and H than originally planned. The company anticipates first oil from Foster Creek phase G will now be achieved in the first half of 2016 and from phase H in the first half of 2017.
Cenovus anticipates conventional oil production, including Pelican Lake, to average between 68,000 bbls/d and 72,000 bbls/d net in 2015.
In 2016 and 2017, the company expects to add incremental production capacity of 80,000 bbls/d net at Foster Creek and Christina Lake. Over the longer term, in combination with assets already under production, the company has the potential to achieve total oil production of more than 500,000 bbls/d net by fully developing projects that currently have regulatory approval.
|
Average net production forecast |
|||
|
2015 Budget |
2014 Guidance |
% change1 |
|
|
Foster Creek (Mbbls/d) |
62 – 68 |
57 |
14 |
|
Christina Lake (Mbbls/d) |
67 – 74 |
67 |
5 |
|
Total oil sands (Mbbls/d) |
129 – 142 |
124 |
9 |
|
Conventional oil (Mbbls/d)2 |
68 – 72 |
74 |
-5 |
|
Total oil (Mbbls/d) |
197 – 214 |
198 |
4 |
|
Natural gas (MMcf/d) |
420 – 455 |
485 |
-10 |
|
1 |
Percentage change based on the midpoints of the ranges. |
|
2 |
Includes Pelican Lake as well as oil and NGLs from Alberta and Saskatchewan. |
Improving market access
Cenovus has an integrated portfolio that includes growing production from oil sands and conventional operations, ownership in two U.S. refineries and growing exposure to pipeline and rail shipping capacity. The company’s integration along the entire oil value chain helps reduce its overall risk and gives it flexibility to adapt to shifting market conditions.
Cenovus continues to strengthen its integration along the value chain by pursuing a vigorous market access strategy to gain global pricing for its oil and maximize shareholder value. These efforts continue to yield results. In 2014, the company increased its marketing of heavy oil blend to sales points outside of Alberta. In 2015 and beyond, Cenovus will look for additional opportunities to further increase its sales in these higher-priced markets.
“Finding new customers and achieving the best possible pricing for our oil are an important part of our long-term growth strategy,” said Ferguson. “Over the last two years, we’ve looked at every reasonable option to profitably increase our market access. I’m very encouraged by what we’ve come up with and we’re now working towards implementing the most promising opportunities.”
Cenovus’s market access strategy includes continued support for proposed new pipeline projects that would connect to new markets in the U.S. and, through port facilities, to overseas markets. Cenovus has committed to move 200,000 bbls/d on the proposed Energy East pipeline, another 175,000 bbls/d on proposed pipelines to the West Coast and 75,000 bbls/d to the U.S. Gulf Coast on the planned Keystone XL system. In addition, the company has 50,000 bbls/d of contracted capacity on the Flanagan South system, increasing to 75,000 bbls/d in 2018. Initial deliveries on Flanagan South to the major oil hub at Cushing, Oklahoma were completed earlier this month.
Cenovus currently has 30,000 bbls/d of available rail loading capacity. The company continues to view rail as an important long-term component of its transportation strategy, adding value by easing pipeline congestion and pricing pressure while also providing access to niche markets that offer premium pricing for Canadian heavy oil. Over the longer term, the company is planning on moving between 10% and 20% of its oil production to market by rail.
Cenovus is also working with customers to assess options to maximize the value of its oil by offering a wider range of products to command higher netbacks. This could include existing dilbit blends, underblended bitumen or even dry bitumen. In addition, the company continues to assess profitable options for expanding its refining capacity to ensure that it maintains its relative exposure to global pricing for refined products as its overall production grows.
Building reserves
Cenovus believes it will be in a position to add in the order of 150 million barrels of proved reserves at its oil sands operations in 2014. The majority of the additions are a result of a development area expansion at Foster Creek plus recognition of improved performance at Christina Lake. The Cenovus-wide reserves evaluation, prepared by independent qualified reserves evaluators, is due in February 2015. The company plans to drill approximately 300 gross stratigraphic test wells in 2015 to support future reserves growth and regulatory approvals.
Cenovus anticipates corporate proved finding and development costs in 2014 to be in the range of $15.00/bbl to $18.00/bbl of oil equivalent, not including changes in future development costs. The company expects its three-year average finding and development costs will be about $12.50/bbl of oil equivalent based on the midpoint of the 2014 range.
Creating value for shareholders
Cenovus is focused on delivering solid long-term total shareholder return. The company is committed to maintaining its dividend in 2015 and to providing meaningful dividend increases over time as the company continues to grow. Declaration of dividends is at the sole discretion of the Cenovus Board of Directors.
Cenovus also remains committed to building net asset value over time. However, lower energy prices and continuing market congestion have reduced the value the company has been able to receive for its oil in recent months. In response, Cenovus has chosen to slow its pace of investment and is no longer targeting to double its 2010 illustrative net asset value by the end of 2015, as originally planned.
Cenovus Announces Amendments to its Bylaws
Effective December 10, 2014, Cenovus’s Board of Directors approved amendments to its By-law No. 1 (collectively, the “By-law Amendments”). Among other things, the By-law Amendments establish a framework for advance notice of nominations of directors by shareholders. The By-law Amendments are effective immediately. Shareholders of Cenovus will be asked to ratify and confirm the By-law Amendments at the next meeting of shareholders, as required by the Canada Business Corporations Act. The full text of By-law No. 1, as amended by the By-law Amendments, has been filed under Cenovus’s profile at sedar.com and posted on cenovus.com.
NOTE: Cenovus has made its 2015 guidance available at cenovus.com under ‘Invest in us.’
|
Oil sands project schedule1,2 |
|||
|
Project phase |
First production target |
Expected total production |
|
|
Foster Creek3A – F4 |
150,000 |
||
|
G4 |
1H 2016F |
30,000 |
|
|
H4 |
1H 2017F |
30,000 |
|
|
J |
TBD |
50,000 |
|
|
Potential optimization |
TBD |
50,000 |
|
|
Christina Lake3A – E |
138,000 |
||
|
Optimization |
Q4 2015F |
22,000 |
|
|
F |
2016F |
50,000 |
|
|
G |
2017F |
50,000 |
|
|
H |
TBD |
50,000 |
|
|
Narrows Lake3 |
|||
|
A |
TBD |
45,000 |
|
|
Future phases |
TBD |
85,000 |
|
|
Grand Rapids |
|||
|
A |
TBD |
8,000 – 10,000 |
|
|
Future phases |
TBD |
170,000 |
|
|
Telephone Lake5 |
TBD |
90,000 |
|
|
1 |
Updated December 11, 2014. |
|
2 |
Total production capacity indicates projected potential for each project. |
|
3 |
Properties 50% owned by ConocoPhillips. Certain phases may be subject to partner approval. |
|
4 |
Each of phases F, G, H is expected to ramp up to 30,000 bbls/d within approximately 18 months from first production. |
|
5 |
Projected total capacity of more than 300,000 bbls/d. |
|
2015 Budget webcast today |
|
9 a.m. Mountain Time (11 a.m. Eastern Time) |
|
Cenovus will host a conference call today, December 11, 2014, starting at 9 a.m. MT (11 a.m. ET). To participate, please dial 888-231-8191 (toll-free in North America) or 647-427-7450 approximately 10 minutes prior to the conference call. An archived recording of the call will be available from approximately 12 p.m. MT on December 11, 2014 until 10 p.m. MT on December 18, 2014 by dialing 855-859-2056 or 416-849-0833 and entering password 32987005. A live audio webcast of the conference call will also be available via cenovus.com. The webcast will be archived for approximately 90 days. |
[expand title=”Advisories & Contact”]ADVISORY
FINANCIAL INFORMATION
Basis of Presentation Cenovus reports financial results in Canadian dollars and presents production volumes on a net to Cenovus before royalties basis, unless otherwise stated. Cenovus prepares its financial statements in accordance with International Financial Reporting Standards (IFRS).
Non-GAAP Measures This news release contains references to non-GAAP measures as follows:
These measures have been described and presented in this news release in order to provide shareholders and potential investors with additional information regarding Cenovus’s liquidity and its ability to generate funds to finance its operations. For further information, refer to Cenovus’s most recent Management’s Discussion & Analysis (MD&A) available at cenovus.com.
FORWARD-LOOKING INFORMATION
This document contains certain forward-looking statements and other information (collectively “forward-looking information”) about our current expectations, estimates and projections, made in light of our experience and perception of historical trends. Forward-looking information in this document is identified by words such as “anticipate”, “believe”, “expect”, “plan”, “forecast” or “F”, “target”, “projected”, “could”, “focus”, “proposed”, “schedule”, “potential”, “may”, “strategy” or similar expressions and includes suggestions of future outcomes, including statements about our growth strategy and related schedules, projections contained in our 2014 and 2015 guidance, anticipated finding and development costs, expected reserves and resources additions, growing total shareholder return, forecast operating and financial results, planned capital expenditures, expected future production, including the timing, stability or growth thereof, expected increase in production capacity through optimization activity and debottlenecking, expected future refining capacity, broadening market access, improving cost structures, potential dividends and dividend growth strategy, anticipated timelines for future regulatory, partner or internal approvals, future impact of regulatory measures, forecasted commodity prices, future use and development of technology, including to reduce our environmental impact and projected increasing shareholder value. Readers are cautioned not to place undue reliance on forward-looking information as our actual results may differ materially from those expressed or implied.
Developing forward-looking information involves reliance on a number of assumptions and consideration of certain risks and uncertainties, some of which are specific to Cenovus and others that apply to the industry generally.
The factors or assumptions on which the forward-looking information is based include: assumptions disclosed in our current guidance, available at cenovus.com; our projected capital investment levels, the flexibility of our capital spending plans and the associated source of funding; estimates of quantities of oil, bitumen, natural gas and liquids from properties and other sources not currently classified as proved; our ability to obtain necessary regulatory and partner approvals; the successful and timely implementation of capital projects or stages thereof; our ability to generate sufficient cash flow from operations to meet our current and future obligations; and other risks and uncertainties described from time to time in the filings we make with securities regulatory authorities.
2015 guidance, available at cenovus.com, is based on an average diluted number of shares outstanding of approximately 760 million. It assumes: Brent US$84.50/bbl, WTI US$77.00/bbl; Western Canada Select US$60.50/bbl; NYMEX US$3.95/MMBtu; AECO $3.60/GJ; Chicago 3-2-1 Crack Spread US$15.50/bbl; exchange rate of $0.88 US$/C$.
The company’s supply costs reflect an estimated long-term WTI price that provides a project-specific after-tax rate of return of at least 9% on future capital investment. Underlying assumptions in Cenovus’s calculation of supply costs include: price forecast and associated royalties, capital costs, operating expenses, reservoir performance and discount rates.
The risk factors and uncertainties that could cause our actual results to differ materially include: volatility of and assumptions regarding oil and gas prices; the effectiveness of our risk management program, including the impact of derivative financial instruments and the success of our hedging strategies; the accuracy of cost estimates; fluctuations in commodity prices, currency and interest rates; fluctuations in product supply and demand; market competition, including from alternative energy sources; risks inherent in our marketing operations, including credit risks; maintaining desirable ratios of debt to adjusted EBITDA as well as debt to capitalization; our ability to access various sources of debt and equity capital; accuracy of our reserves, resources and future production estimates; our ability to replace and expand oil and gas reserves; our ability to maintain our relationships with our partners and to successfully manage and operate our integrated heavy oil business; reliability of our assets; potential disruption or unexpected technical difficulties in developing new products and manufacturing processes; refining and marketing margins; potential failure of new products to achieve acceptance in the market; unexpected cost increases or technical difficulties in constructing or modifying manufacturing or refining facilities; unexpected difficulties in producing, transporting or refining of crude oil into petroleum and chemical products; risks associated with technology and its application to our business; the timing and the costs of well and pipeline construction; our ability to secure adequate product transportation, including sufficient crude-by-rail or other alternate transportation; changes in the regulatory framework in any of the locations in which we operate, including changes to the regulatory approval process and land-use designations, royalty, tax, environmental, greenhouse gas, carbon and other laws or regulations, or changes to the interpretation of such laws and regulations, as adopted or proposed, the impact thereof and the costs associated with compliance; the expected impact and timing of various accounting pronouncements, rule changes and standards on our business, our financial results and our consolidated financial statements; changes in the general economic, market and business conditions; the political and economic conditions in the countries in which we operate; the occurrence of unexpected events such as war, terrorist threats and the instability resulting therefrom; and risks associated with existing and potential future lawsuits and regulatory actions against us.
Readers are cautioned that the foregoing lists are not exhaustive and are made as at the date hereof. For a full discussion of our material risk factors, see “Risk Factors” in our most recent Annual Information Form/Form 40-F, “Risk Management” in our current and annual MD&A and risk factors described in other documents we file from time to time with securities regulatory authorities, all of which are available on SEDAR at sedar.com, EDGAR at sec.gov and our website at cenovus.com.
TM denotes a trademark of Cenovus Energy Inc.
Cenovus Energy Inc.
Cenovus Energy Inc. is a Canadian integrated oil company. It is committed to applying fresh, progressive thinking to safely and responsibly unlock energy resources the world needs. Operations include oil sands projects in northern Alberta, which use specialized methods to drill and pump the oil to the surface, and established natural gas and oil production in Alberta and Saskatchewan. The company also has 50% ownership in two U.S. refineries. Cenovus shares trade under the symbol CVE, and are listed on the Toronto and New York stock exchanges. Its enterprise value is approximately $21 billion. For more information, visit cenovus.com.
Find Cenovus on Facebook, Twitter, LinkedIn, YouTube and Instagram.
SOURCE Cenovus Energy Inc.
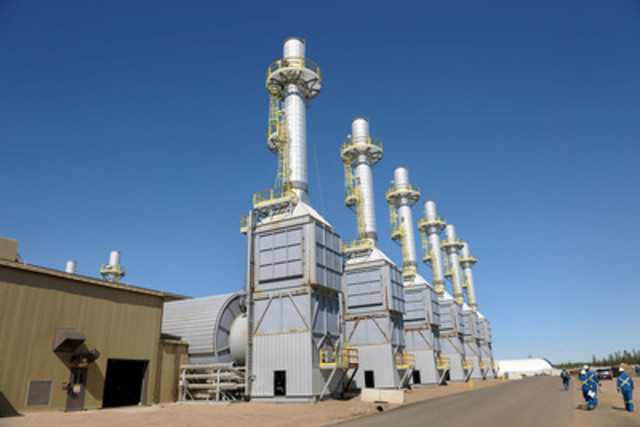
Image with caption: “Steam generators at Cenovus’s Foster Creek project in northern Alberta. The project uses a process called steam-assisted gravity drainage (SAGD) to produce oil, which involves drilling into the reservoir and injecting steam at a low pressure to soften the oil so it can be pumped to the surface. (CNW Group/Cenovus Energy Inc.)”. Image available at: http://photos.newswire.ca/images/download/20141211_C4541_PHOTO_EN_9298.jpg
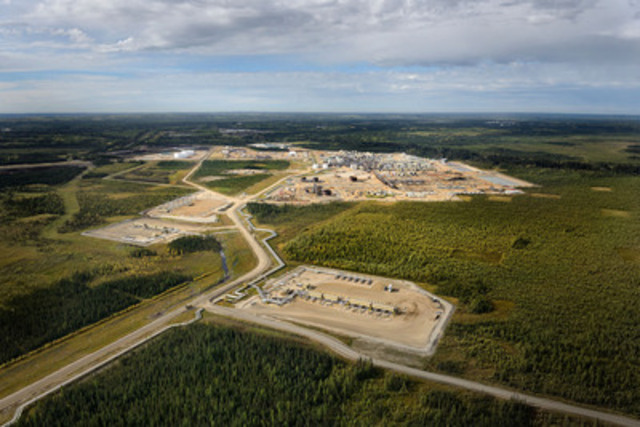
Image with caption: “Cenovus’s Christina Lake project in northern Alberta uses steam-assisted gravity drainage (SAGD) to produce oil. The process involves drilling into the reservoir and injecting steam at a low pressure to soften the oil so it can be pumped to the surface. (CNW Group/Cenovus Energy Inc.)”. Image available at: http://photos.newswire.ca/images/download/20141211_C4541_PHOTO_EN_9299.jpg
For further information: CENOVUS CONTACTS: Investor Relations: Susan Grey, Director, Investor Relations, 403-766-4751; Graham Ingram, Senior Analyst, Investor Relations, 403-766-2849; Anna Kozicky, Senior Analyst, Investor Relations, 403-766-4277; Steve Murray, Senior Analyst, Investor Relations, 403-766-3382; Media: Brett Harris, Media Lead, 403-766-3420; Media Relations general line: 403-766-7751[/expand]