Each week, XI Technologies scans its unique combination of enhanced industry data to provide trends and insights that have value for professionals doing business in the WCSB. If you’d like Wednesday Word to the Wise delivered directly to your inbox, subscribe here.
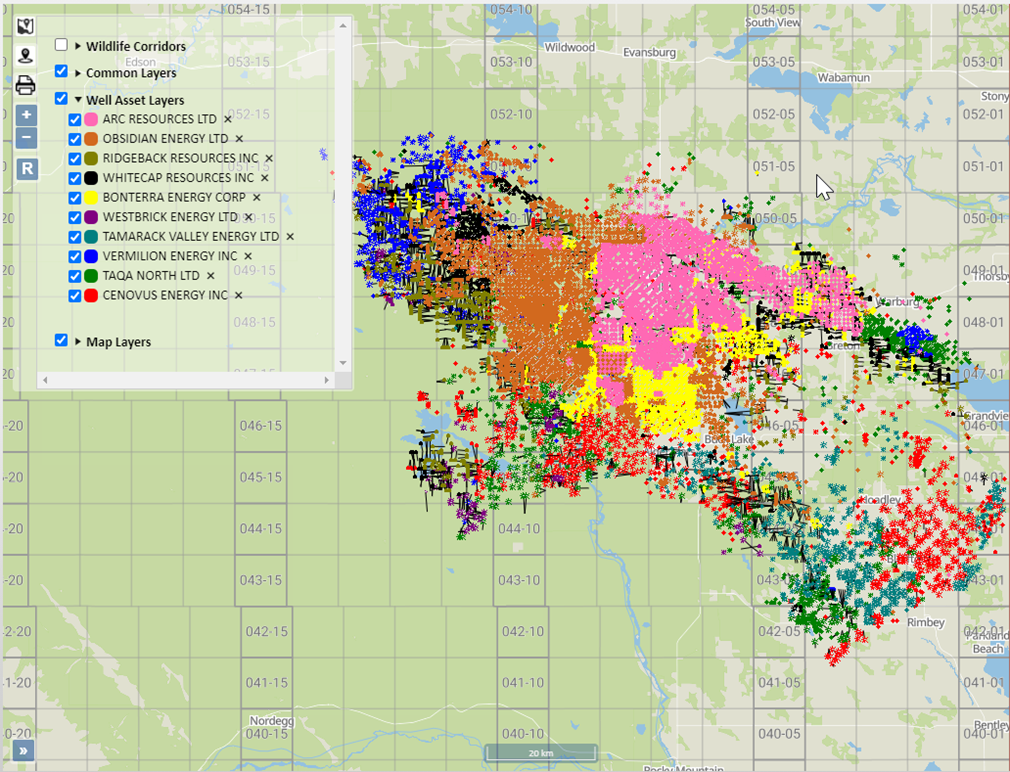
XI has covered the Montney play in March and the Duvernay in April. Today, we’ll draw on XI Technologies’ enriched industry data to offer a few perspectives as to what’s happening in the field of Pembina. This long-standing field just keeps ticking along and makes up a substantial chunk of several well-known companies’ production portfolios.
The ownership of Pembina assets is concentrated in 19 companies, but there are an additional 131 companies who currently own production in this area.
Pulling a quick search of the Pembina field, we can quickly see that Cenovus Energy Inc. (Cenovus) is the largest player. In fact, when we look back to 2017 we can see that Cenovus has consistently owned between 10-12% of the production in this area.
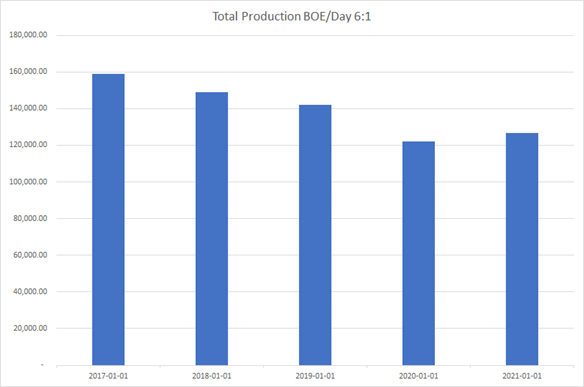
Looking at this field over time is interesting. We can see a contraction of production (ending in 2020) from 2017 on:
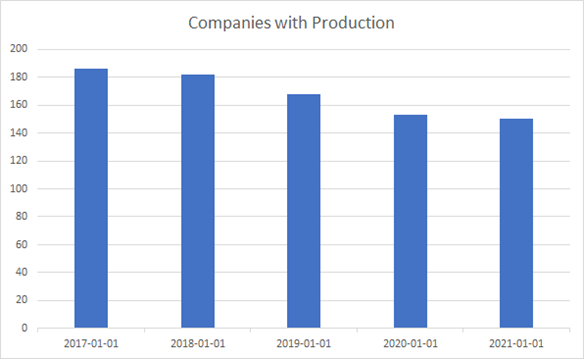
We can also see a 19% contraction of companies with production in this area from 2017 to today:
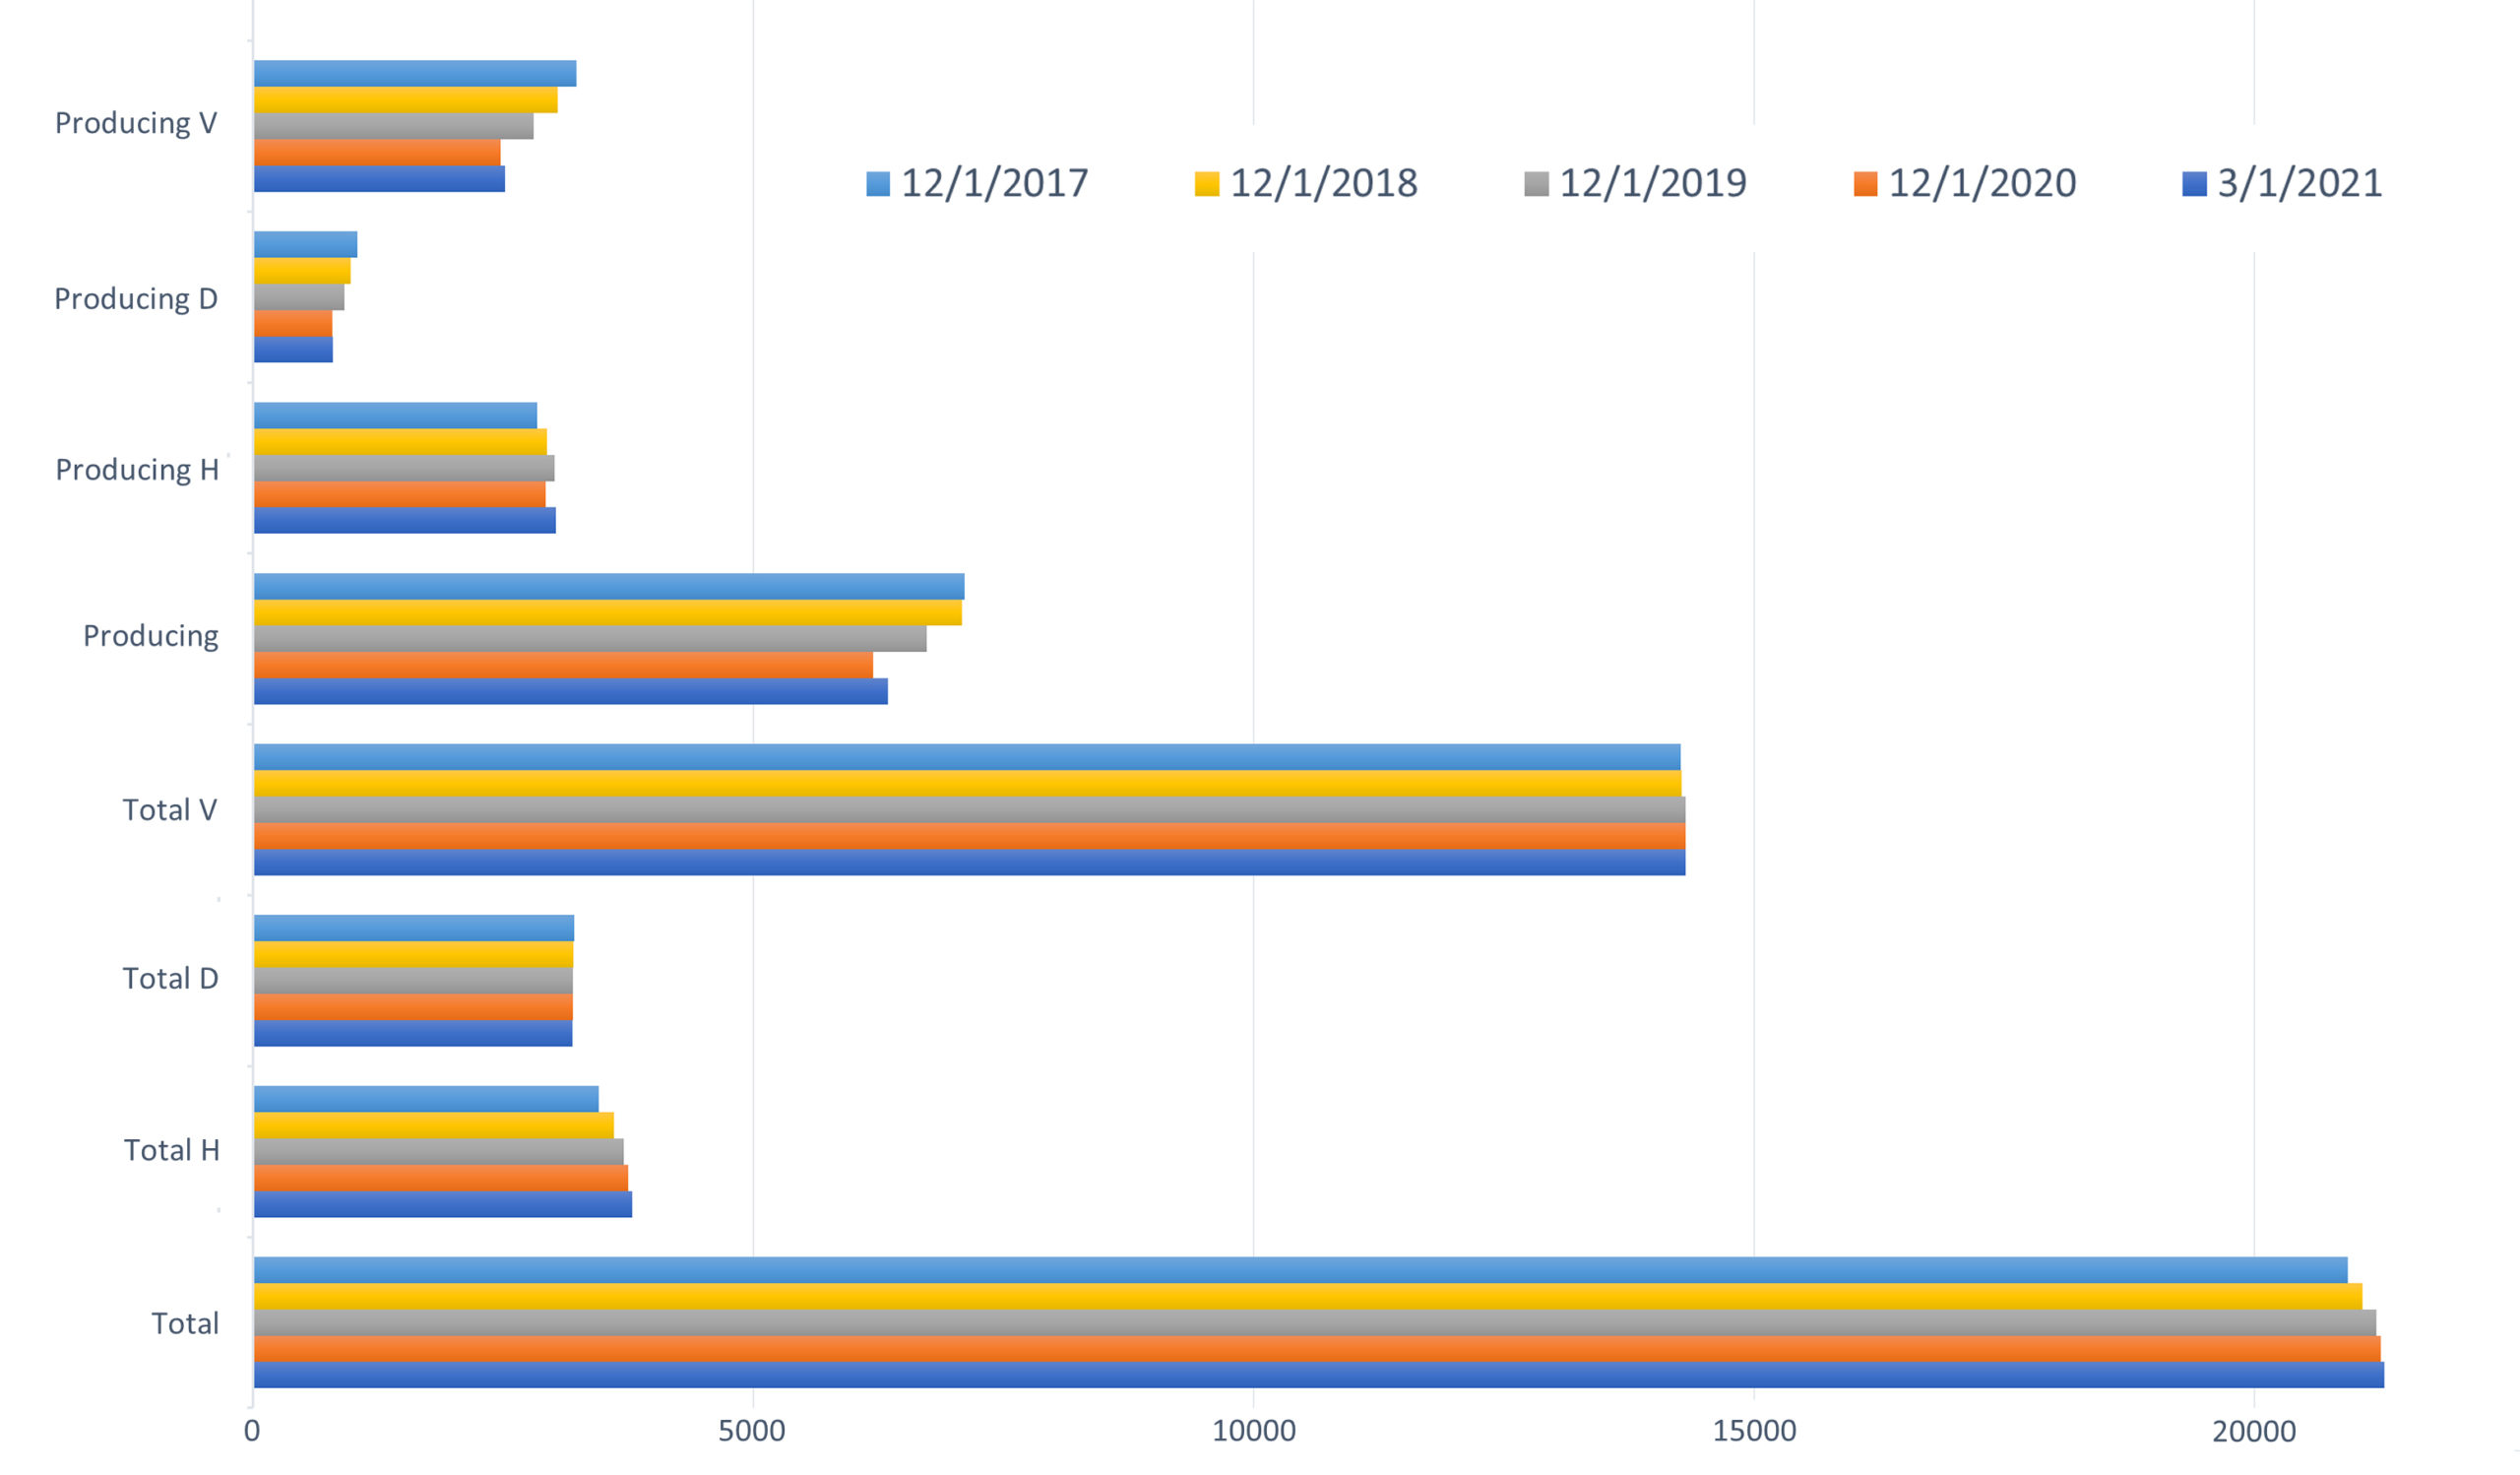
Lastly, it is interesting to look at the wells in this field and the gradual shift to horizontal from a traditional vertical play:
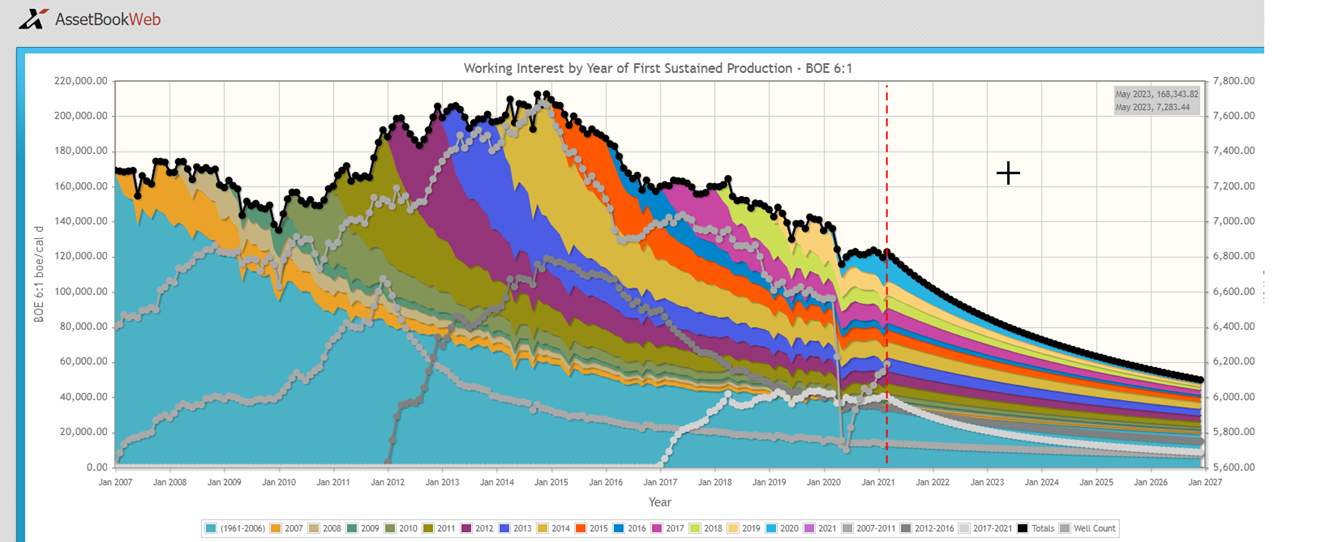
Let’s investigate the Pembina field a little further. Looking at the vintage of this production, it’s confirmed that most activity in the Pembina is legacy with a good percentage of the production coming from pre-2006 wells.
Because this production is older, the ARO Obligations become extremely important. If companies are hoping to acquire rich and long-lived Pembina assets, it is essential to look at liabilities among various acquisition opportunities to determine differences in future obligations. This is particularly apparent when you look at the active vs inactive liability and see that approximately 36% of the well licenses in the field are inactive accounting for 39% of the total ARO obligation of the field. You can download an ARO Overview Report here.
Contact XI Technologies for further information on creating ARO projections.
____________________________________________________________________________________
If you’d like to learn more about how XI’s AssetSuite software can analyze regions throughout Western Canada, visit our website or contact XI Technologies.