Massive M&A news early on Monday morning, as Whitecap Resources and Veren announced that the two companies will combine in a $15 billion transaction to create a leading Canadian light oil and condensate producer.
To review the M&A slide deck provided by Whitecap and Veren, click here.
To listen to the webcast about the transaction, click here.
Lots has been written in a short period of time about the combination, so this article will take a slightly different slant.
Whitecap has indicated that this will make the combined entity the 7th largest E&P in Canada, providing the kind of size and scale necessary to appeal to larger institutional investors as well as to gain economies of scale necessary to compete in a volatile oil and gas world. It will also become the largest landholder in the Alberta Montney and largest operator in the Duvernay (by land and production).
Based on our analysis of the public data, the combined company will be very similar in production size to ARC Resources, so we thought it might be worthwhile to see how the combined Whitecap Resources might stack up next to ARC. None of this is investment advice of course, and it’s not to say one is better than the other, but simply to display some interesting data.
Figure 1 below shows the public data from BOE Intel, based on gross licensed production (an aggregation of all wells licensed to the company at an assumed 100% working interest) for the month of December 2024.
Figure 1 – Gross licensed production – December 2024 (turn phone sideways to view table on mobile)
| Name | Gross Licenced Production (boe/d) | Gross Oil (bbl/d) | Gross C5 + Condensate (bbl/d) | Gross C2+C3+C4 (bbl/d) | Gross Natural Gas (mmcf/d) | Producing Wells | Production per Producing Well (boe/d) |
|---|---|---|---|---|---|---|---|
| ARC Resources Ltd. | 376,995 | 6,391 | 94,286 | 26,496 | 1,499 | 1,935 | 195 |
| Combined Whitecap + Veren | 372,092 | 161,766 | 41,810 | 25,997 | 855 | 12,017 | 31 |
A couple interesting things jump out here:
- The pro-forma Whitecap will have about double the oil/condensate volumes as ARC.
- On a production per producing well basis, ARC produces ~195 BOE/d per producing well compared to combined Whitecap at 31 BOE/d per producing well. Much of the difference here likely comes down to the fact that ARC is the more “pure-play” Montney producer, whereas the combined Whitecap will still have significant contribution from conventional light oil assets.
Figure 2 below takes a look at the operating netbacks for the 3 companies over time. Unsurprisingly, Whitecap and Veren have held an edge in this department as a result of the historically higher oil/condensate weighting. LNG offtake agreements have the potential to alter the traditional netback trends of these producers….see ARC’s agreement with ExxonMobil announced yesterday, while also wonder about the potential for Whitecap after comments in the webcast (around the 30 minute mark) that both Whitecap and Veren have been in negotiations with Pembina in regards to Cedar LNG.
Figure 2 – Operating netback (after hedging)
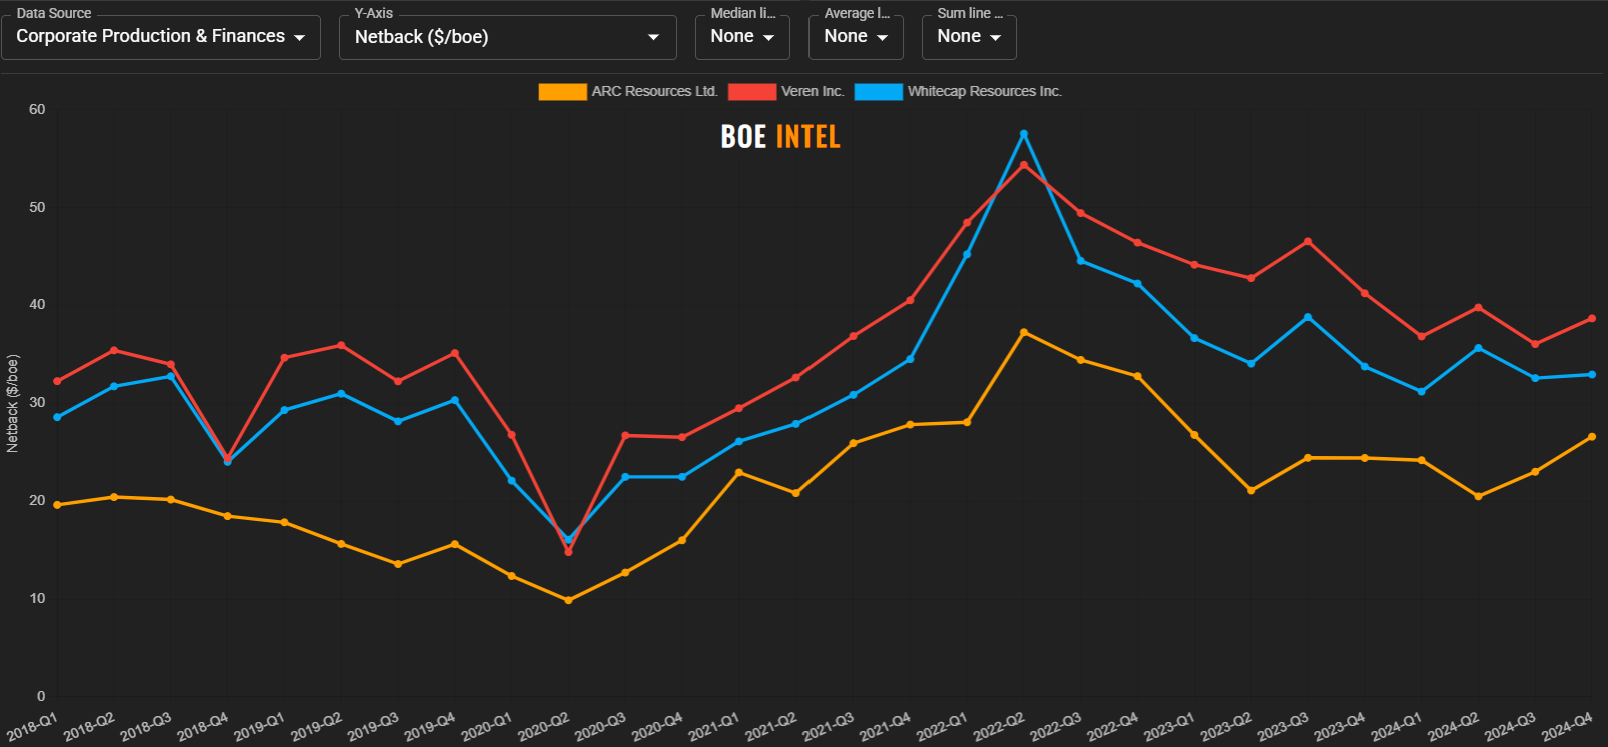
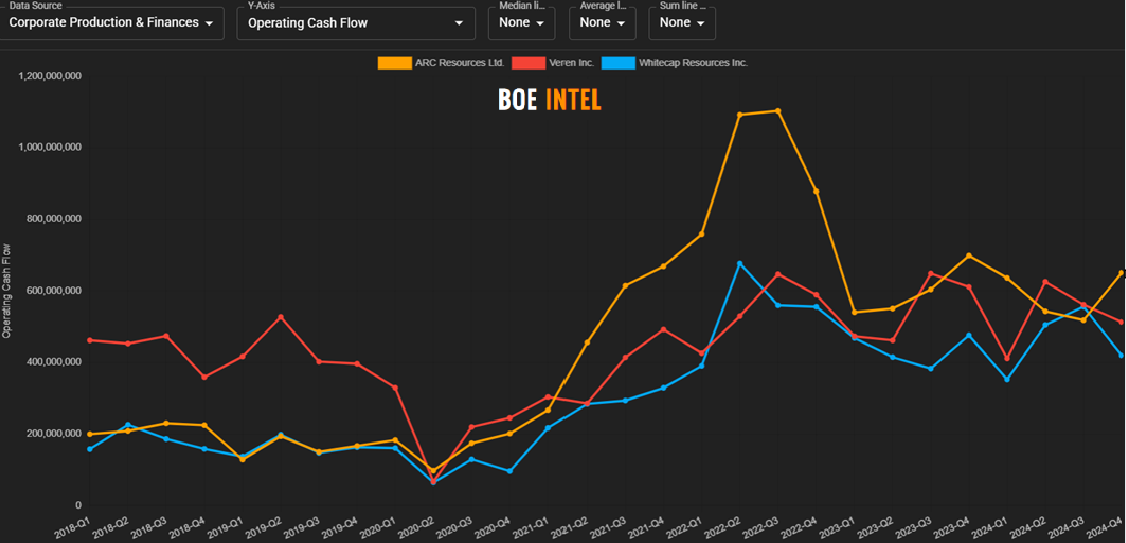
Figure 3 below show the historical operating cash flow reported by the 3 companies. One can see the sensitivity to natural gas and condensate prices evident in ARC Resources as operating cash flow exploded higher in 2022 as natural gas and condensate prices surged…recall that ARC is Canada’s largest condensate producer.
Figure 3 – Operating cash flow
While BOE Intel doesn’t have forward looking estimates, it can show historical trading multiples. The following two charts (Figures 4 and 5) show a couple of different ways of looking at company valuation on a trailing basis.
Of note in Figure 4, ARC Resources had typically traded at a flowing barrel valuation discount to Whitecap and Veren until recently, while in Figure 5 ARC can be seen trading at a significant premium to Whitecap and Veren on a trailing EV/OCF basis after historically being rather equal. There could be several reasons for ARC’s new found valuation premium: 1) ARC has earned a premium multiple advantage due to size/performance/LNG optionality; 2) the market being forward looking and assuming natural gas prices will improve more so than oil after a particularly weak year for Canadian gas prices in particular; 3) LNG Canada startup is nearing and the market is becoming more optimistic on natural gas vs. oil; 4) ARC being able to sign LNG agreements to potentially increase its netback profile. Other reasons likely exist as well. Of course the other side of the coin is that maybe Whitecap and Veren have become too cheap in the eyes of the market, and that this transaction is being done to attempt to reclaim a higher multiple that often comes with being a larger producer.
Figure 4 – EV/BOE/d
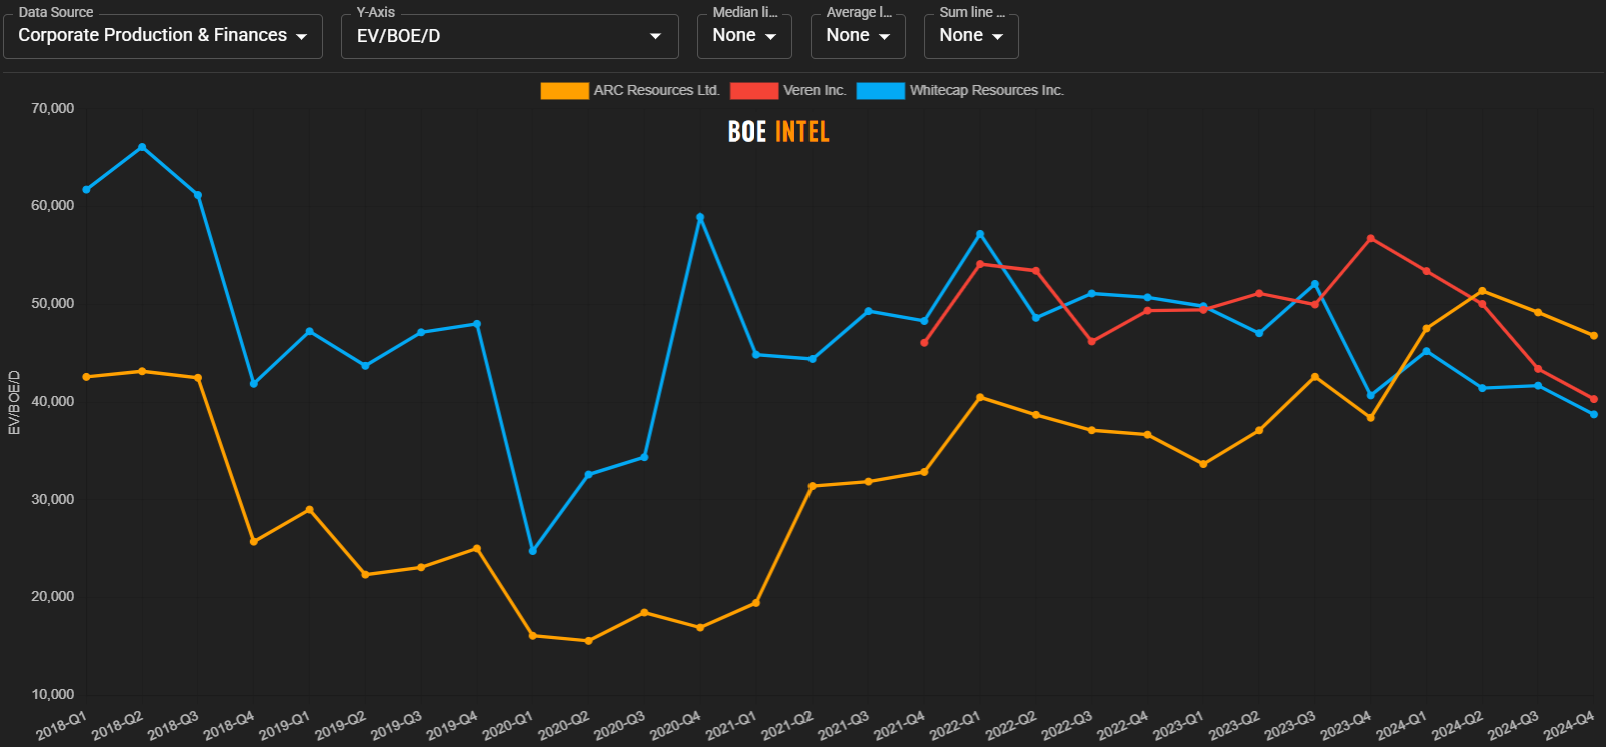
Figure 5 – EV/OCF (*trailing basis, see below)

*BOE Intel’s EV/OCF uses a sum of the prior 4 quarters operating cash flow to make a trailing 12 month OCF figure.
Our completely unscientific poll that ran yesterday on X after the transaction was announced seems to back up that theory. 75% of respondents suggested that they would be more likely to invest in Whitecap after this transaction as opposed to Whitecap or Veren individually before.
Poll #2. If you owned neither, are you more likely to want to buy the combined company now as opposed to one or the other before? $wcp.to $vrn.to
— BOE Report (@BOEReport) March 10, 2025