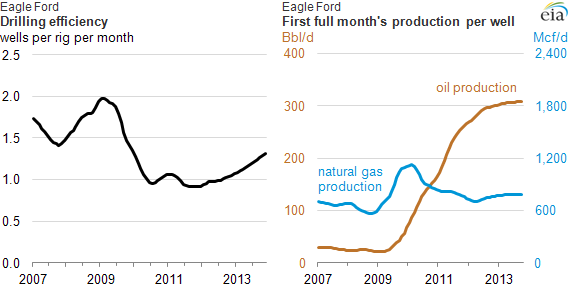
Increases in drilling efficiency have contributed to the breakdown of traditional methods that seek to estimate oil and natural gas production based principally on rig counts. The Drilling Productivity Report (DPR) analyzes drilling efficiency using the average number of wells a rig can drill over a period of time (left chart above) as well as a measure of how productive each new well is expected to be (right chart above).
Average measures are used for drilling speed and well productivity because even in a small geographic area the geology of a play can be diverse, and rig or well performance can vary dramatically. But in the portfolio-style analysis presented in the DPR, a focus on the expected values for all rigs and wells in a play allows for a useful and relevant analysis of how the rig count seen today contributes to the overall change in oil and natural gas production.
EIA estimates drilling efficiency (the number of wells drilled per rig each month) by tracking the number of rigs in a play as well as the number of new wells started each month. Using an appropriate lag for each region based on changes in the rig count relative to changes in new-well counts, this measure of drilling efficiency can be used to estimate how many new wells were started and should start producing in the coming months.
Average completion time for wells is a key but unobservable variable. After drilling, the time it takes to prepare the well for production, including hydraulic fracturing, may vary for several reasons, including:
- Lack of crews. The unavailability of completion crews can cause delays and increase the backlog of wells awaiting completion.
- Market pricing. Producers may decide to hold off completing the well—an expensive process—because of the level of prevailing or expected future (forward) natural gas prices.
- Logistics and infrastructure. Producers may defer completing a well because of a lack of infrastructure to process or move the production to market.
While these factors cannot be measured precisely, observing the trend in the number of new wells following the rig count serves as a proxy measurement for the lag between observing a rig drilling and the new well beginning to produce.
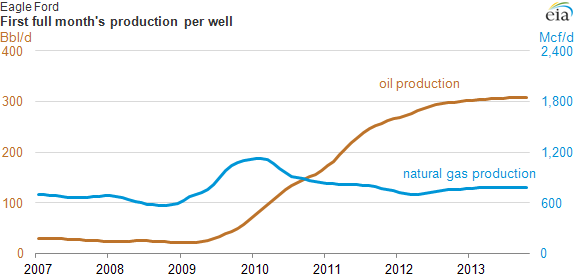
Tracking the production from all wells in their first full month of production and dividing by the number of contributing wells gives an estimate of average well productivity. This measure represents the expected amounts of both oil and natural gas that will be produced from each new well, as shown in the chart above. The trend in initial production per well from the DPR is an input for determining initial production rates and future well performance for EIA’s Short-Term Energy Outlook oil production model.
To relate the observed rig count to future production, DPR uses trends in the number of new wells drilled per active rig in the region and in the average productivity of new wells. These trends represent the combined effects of changes in technology and the quality of resources being accessed within the region, which inform EIA production estimates.