e in a position to add more than 150 million barrels of proved reserves at its oil sands operations in 2013. The majority of the additions are a result of development area expansions at Foster Creek and Christina Lake, plus recognition of improved recovery techniques for Christina Lake and Narrows Lake. The company plans to drill approximately 300 stratigraphic test wells in 2014 to support reserve bookings, as well as regulatory approvals. The Cenovus-wide 2013 reserves evaluation, prepared by independent qualified reserves evaluators, is due in February 2014.
Cenovus anticipates corporate proved finding and development costs in 2013 to be in the range of $15.00 to $18.00 per barrel of oil equivalent, not including changes in future development costs. The company expects its three-year average finding and development costs will be about $9.50 per barrel of oil equivalent based on the midpoint of the 2013 range.
NOTE: Cenovus has made its 2014 guidance available at cenovus.com under ‘Invest in us.’
| Oil sands project schedule | |||||
| Project phase | Regulatory status | First production target | Expected production capacity (bbls/d) gross |
||
| Foster Creek1A – E | 120,000 | ||||
| F | Approved | Q3-2014F | 45,0002 | ||
| G | Approved | 2015F | 40,000 | ||
| H | Approved | 2016F | 40,000 | ||
| J | Submitted Q1-2013 | 2019F | 50,000 | ||
| Future optimization | 15,000 | ||||
| Total capacity | 310,000 | ||||
| Christina Lake1A – E | 138,000 | ||||
| Optimization (phases CDE) | Approved | 2015F | 22,0003 | ||
| F | Approved | 2016F | 50,000 | ||
| G | Approved | 2017F | 50,000 | ||
| H | Submitted Q1-2013 | 2019F | 50,000 | ||
| Total capacity | 310,000 | ||||
| Narrows Lake1 | |||||
| A | Approved | 2017F | 45,000 | ||
| B-C | Approved | TBD | 85,000 | ||
| Total capacity | 130,000 | ||||
| Telephone Lake4 | Submitted Q4-2011 | TBD | 90,000 | ||
| Grand Rapids | Submitted Q4-2011 | TBD | 180,000 | ||
| 1 | Properties 50% owned by ConocoPhillips. Certain phases may be subject to partner approval. |
| 2 | Includes 5,000 bbls/d gross submitted to the regulator in Q1 2013. |
| 3 | Increased from 12,000 bbls/d in Q2 2013 due to the addition of blowdown boilers. |
| 4 | Projected total capacity of more than 300,000 bbls/d. |
2014 Budget webcast today
9 a.m. Mountain Time (11 a.m. Eastern Time)
Cenovus will host a conference call today, December 12, 2013, starting at 9 a.m. MT (11a.m. ET). To participate, please dial 888-231-8191 (toll-free in North America) or 647-427-7450 approximately 10 minutes prior to the conference call. An archived recording of the call will be available from approximately 1 p.m. MT on December 12, 2013 until 10 p.m. MT on December 19, 2013 by dialing 855-859-2056 or 416-849-0833 and entering password 31908785. A live audio webcast of the conference call will also be available via cenovus.com. The webcast will be archived for approximately 90 days.
ADVISORY
FINANCIAL INFORMATION
Basis of Presentation Cenovus reports financial results in Canadian dollars and presents production volumes on a net to Cenovus before royalties basis, unless otherwise stated. Cenovus prepares its financial statements in accordance with International Financial Reporting Standards (IFRS).
Non-GAAP Measures This news release contains references to non-GAAP measures as follows:
- Operating cash flow is defined as revenues, less purchased product, transportation and blending, operating expenses, production and mineral taxes plus realized gains, less realized losses on risk management activities and is used to provide a consistent measure of the cash generating performance of the company’s assets and improves the comparability of Cenovus’s underlying financial performance between periods.
- Cash flow is defined as cash from operating activities excluding net change in other assets and liabilities and net change in non-cash working capital, both of which are defined on the Consolidated Statement of Cash Flows in Cenovus’s interim and annual Consolidated Financial Statements.
- Debt to capitalization and debt to adjusted EBITDA are two ratios that management uses to steward the company’s overall debt position as measures of the company’s overall financial strength. Debt is defined as short-term borrowings and long-term debt, including the current portion, excluding any amounts with respect to the partnership contribution payable and receivable. Capitalization is a non-GAAP measure defined as debt plus shareholders’ equity. Adjusted EBITDA is defined as earnings before finance costs, interest income, income tax expense, depreciation, depletion and amortization, asset impairments, unrealized gain or loss on risk management, foreign exchange gains or losses, gains or losses on divestiture of assets and other income and loss, calculated on a trailing 12-month basis.
These measures have been described and presented in this news release in order to provide shareholders and potential investors with additional information regarding Cenovus’s liquidity and its ability to generate funds to finance its operations. For further information, refer to Cenovus’s most recent Management’s Discussion & Analysis (MD&A) available at cenovus.com.
FORWARD-LOOKING INFORMATION
This document contains certain forward-looking statements and other information (collectively “forward-looking information”) about our current expectations, estimates and projections, made in light of our experience and perception of historical trends. Forward-looking information in this document is identified by words such as “anticipate”, “believe”, “expect”, “plan”, “forecast” or “F”, “target”, “project”, “focus”, “proposed”, “scheduled”, “may”, “strategy”, “projected” or similar expressions and includes suggestions of future outcomes, including statements about our growth strategy and related milestones and schedules, projections contained in our 2014 guidance, forecast operating and financial results, planned capital expenditures, expected future production, including the timing, stability or growth thereof, expected future refining capacity, anticipated finding and development costs, expected reserves and contingent resources, broadening market access, improving cost structures, potential dividends and dividend growth strategy, anticipated timelines for future regulatory, partner or internal approvals, future impact of regulatory measures, forecasted commodity prices, future use and development of technology, including to reduce our environmental impact and projected increasing shareholder value. Readers are cautioned not to place undue reliance on forward-looking information as our actual results may differ materially from those expressed or implied.
Certain natural gas volumes have been converted to barrels of oil equivalent (BOE) on the basis of one barrel (bbl) to six thousand cubic feet (Mcf). BOE may be misleading, particularly if used in isolation. A conversion ratio of one bbl to six Mcf is based on an energy equivalency conversion method primarily applicable at the burner tip and does not represent value equivalency at the well head.
Developing forward-looking information involves reliance on a number of assumptions and consideration of certain risks and uncertainties, some of which are specific to Cenovus and others that apply to the industry generally.
The factors or assumptions on which the forward-looking information is based include: assumptions disclosed in our current guidance, available at cenovus.com; our projected capital investment levels, the flexibility of our capital spending plans and the associated source of funding; estimates of quantities of oil, bitumen, natural gas and liquids from properties and other sources not currently classified as proved; our ability to obtain necessary regulatory and partner approvals; the successful and timely implementation of capital projects or stages thereof; our ability to generate sufficient cash flow from operations to meet our current and future obligations; and other risks and uncertainties described from time to time in the filings we make with securities regulatory authorities.
2014 guidance is based on an average diluted number of shares outstanding of approximately 757 million. It assumes: Brent US$105.00/bbl, WTI of US$102.00/bbl; Western Canada Select of US$76.00/bbl; NYMEX of US$4.00/MMBtu; AECO of $3.30/GJ; Chicago 3-2-1 crack spread of US$13.50/bbl; exchange rate of $0.98 US$/C$. For the period 2015 to 2023, assumptions include: Brent US$105.00-US$110.00; WTI of US$100.00-US$106.00/bbl; Western Canada Select of C$81.00-C$91.00/bbl; NYMEX of US$4.25-US$4.75/MMBtu; AECO of C$3.70-C$4.31/GJ; Chicago 3-2-1 crack spread of US$12.00-US$13.00; exchange rate of $1.00 US$/C$; and average diluted number of shares outstanding of approximately 782 million.
The risk factors and uncertainties that could cause our actual results to differ materially, include: volatility of and assumptions regarding oil and gas prices; the effectiveness of our risk management program, including the impact of derivative financial instruments and the success of our hedging strategies; the accuracy of cost estimates; fluctuations in commodity prices, currency and interest rates; fluctuations in product supply and demand; market competition, including from alternative energy sources; risks inherent in our marketing operations, including credit risks; maintaining desirable ratios of debt to adjusted EBITDA as well as debt to capitalization; our ability to access various sources of debt and equity capital; accuracy of our reserves, resources and future production estimates; our ability to replace and expand oil and gas reserves; our ability to maintain our relationships with our partners and to successfully manage and operate our integrated heavy oil business; reliability of our assets; potential disruption or unexpected technical difficulties in developing new products and manufacturing processes; refining and marketing margins; potential failure of new products to achieve acceptance in the market; unexpected cost increases or technical difficulties in constructing or modifying manufacturing or refining facilities; unexpected difficulties in producing, transporting or refining of crude oil into petroleum and chemical products; risks associated with technology and its application to our business; the timing and the costs of well and pipeline construction; our ability to secure adequate product transportation, including sufficient crude-by-rail or other alternate transportation; changes in the regulatory framework in any of the locations in which we operate, including changes to the regulatory approval process and land-use designations, royalty, tax, environmental, greenhouse gas, carbon and other laws or regulations, or changes to the interpretation of such laws and regulations, as adopted or proposed, the impact thereof and the costs associated with compliance; the expected impact and timing of various accounting pronouncements, rule changes and standards on our business, our financial results and our consolidated financial statements; changes in the general economic, market and business conditions; the political and economic conditions in the countries in which we operate; the occurrence of unexpected events such as war, terrorist threats and the instability resulting therefrom; and risks associated with existing and potential future lawsuits and regulatory actions against us.
Readers are cautioned that the foregoing lists are not exhaustive and are made as at the date hereof. For a full discussion of our material risk factors, see “Risk Factors” in our most recent AIF/Form 40-F, “Risk Management” in our current and annual MD&A and risk factors described in other documents we file from time to time with securities regulatory authorities, all of which are available on SEDAR at sedar.com, EDGAR at sec.gov and our website at cenovus.com.
TM denotes a trademark of Cenovus Energy Inc.
Cenovus Energy Inc.
Cenovus Energy Inc. is a Canadian integrated oil company. It is committed to applying fresh, progressive thinking to safely and responsibly unlock energy resources the world needs. Operations include oil sands projects in northern Alberta, which use specialized methods to drill and pump the oil to the surface, and established natural gas and oil production in Alberta and Saskatchewan. The company also has 50% ownership in two U.S. refineries. Cenovus shares trade under the symbol CVE, and are listed on the Toronto and New York stock exchanges. Its enterprise value is approximately $28 billion. For more information, visit cenovus.com.
Find Cenovus on Facebook, Twitter, Linkedin and YouTube.
SOURCE Cenovus Energy Inc.
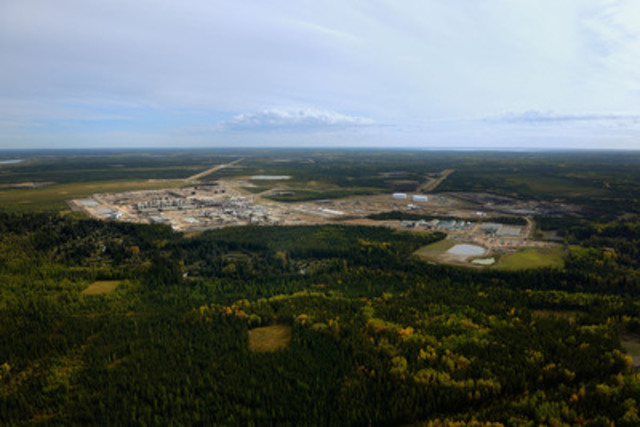
Image with caption: “Cenovus Energy’s Christina Lake oil sands operation in northern Alberta (CNW Group/Cenovus Energy Inc.)”. Image available at: http://photos.newswire.ca/images/download/20131212_C9813_PHOTO_EN_34898.jpg
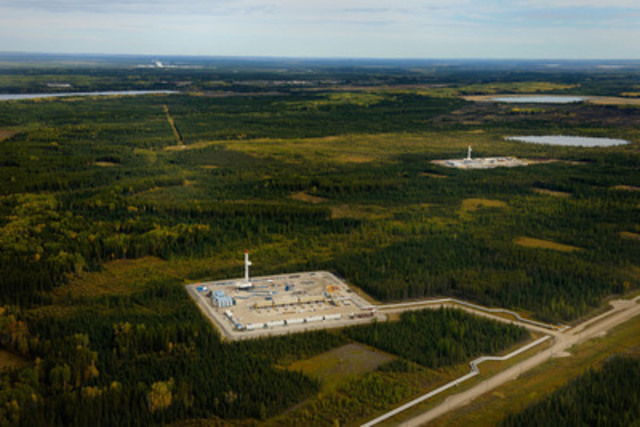
Image with caption: “Wellpads with drilling rigs at Cenovus Energy’s Christina Lake oil sands operation in northern Alberta (CNW Group/Cenovus Energy Inc.)”. Image available at: http://photos.newswire.ca/images/download/20131212_C9813_PHOTO_EN_34899.jpg

 Wellpads with drilling rigs at Cenovus Energy’s Christina Lake oil sands operation in northern Alberta (CNW Group/Cenovus Energy Inc.)
For further information:
CENOVUS CONTACTS:
Investor Relations
Anna Kozicky
Senior Analyst, Investor Relations
403-766-4277
Bill Stait
Senior Analyst, Investor Relations
403-766-6348
Graham Ingram
Senior Analyst, Investor Relations
403-766-2849
Media
Rhona DelFrari
Director, Media Relations
403-766-4740
Jessica Wilkinson
Advisor, Media Relations
403-766-8990
Media Relations general line
403-766-7751