• Sign up for the Daily Digest E-mail
  • Facebook
  • X
  • LinkedIn

BOE Report

Sign up
  • Home
  • StackDX Intel
  • Headlines
    • Latest Headlines
    • Featured Companies
    • Columns
    • Discussions
  • Well Activity
    • Well Licences
    • Well Activity Map
  • Property Listings
  • Land Sales
  • M&A Activity
    • M&A Database
    • AER Transfers
  • Markets
  • Rig Counts/Data
    • CAOEC Rig Count
    • Baker Hughes Rig Count
    • USA Rig Count
    • Data
      • Canada Oil Market Data
      • Canada NG Market Data
      • USA Market Data
      • Data Downloads
  • Jobs

What’s ahead for oil prices? 2008 versus 2014

December 31, 201411:01 PM BOE Report Staff

The recent drop in oil prices bears similarities to the tremendous drop of 2008, possibly foreshadowing what’s to come in the new year.

Let’s have a look back at the performance of crude oil in 2008:

2008 oil price chart

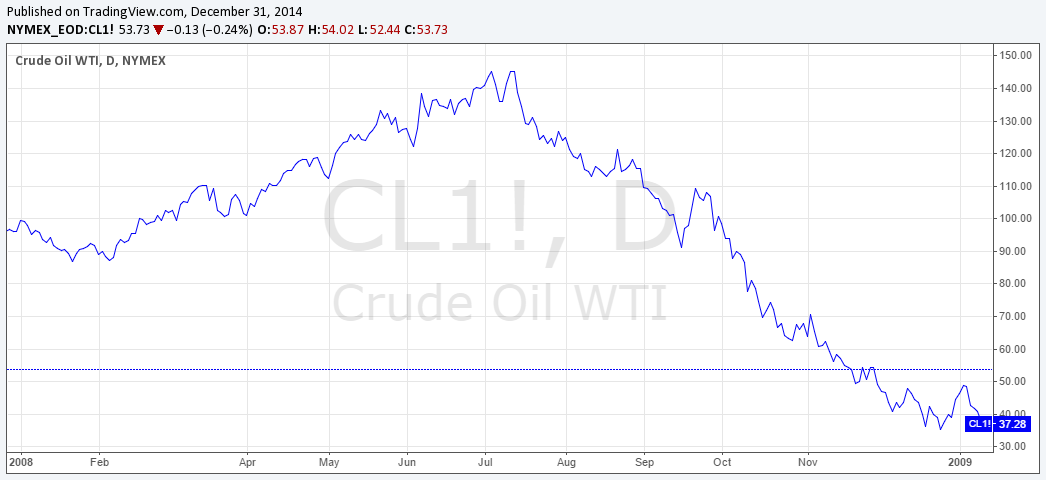
Oil started the year around $100/bbl and quickly shot up to nearly $150 by June. The price then declined by over $110 and by December, WTI crude oil finished near $35/bbl.

Although not as drastic, this year’s price drop is extraordinarily similar in terms of timing and suddenness:

2009 oil price chart

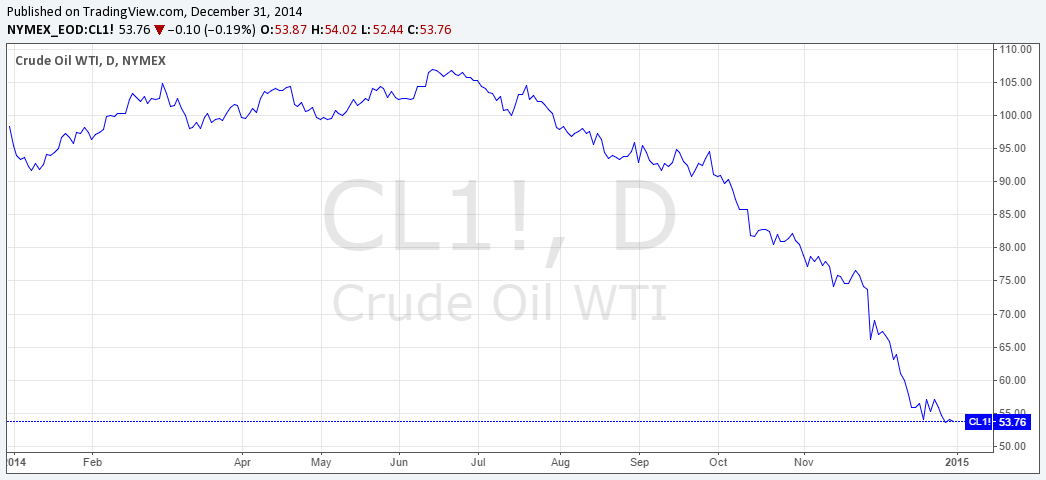
Once again, oil started this year around $100/bbl. Although it lacked the significant price increase seen in early 2008, this year’s oil decline began almost at the same mid-way point of the year. 2014 ended with WTI down 48% to just above $50/bbl.

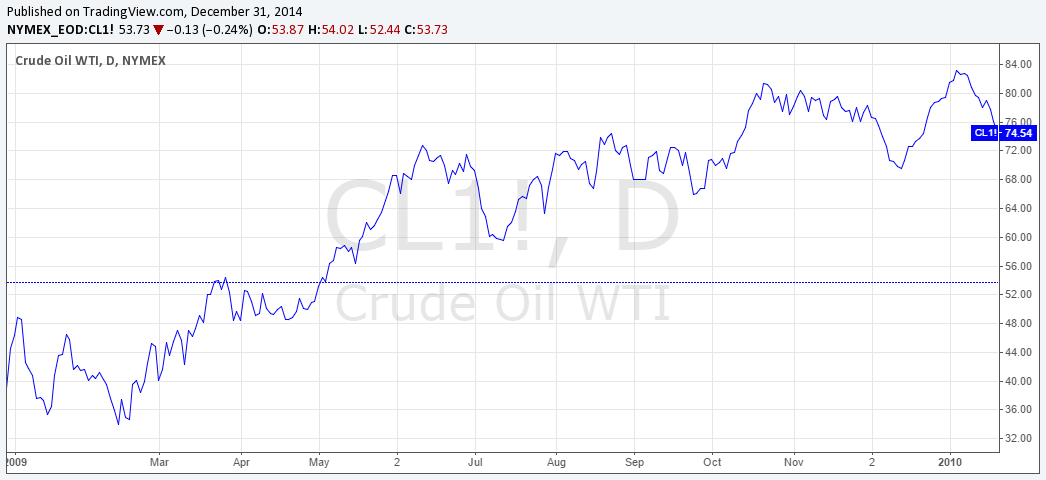
In 2009, however, the price rose nearly 100% to approximately $73/bbl. And although there were no geopolitical factors creating a supply glut, the world economy was tumultuous at best. Something to think about for 2015.

2009 crude oil price chart:
2014 oil price chart

Happy new year from the BOE Report!

Follow BOE Report
  • Facebook
  • X
  • LinkedIn

Sign up for the BOE Report Daily Digest E-mail

Successfully subscribed

Latest Headlines
  • New oil and gas jobs from BOE Report Jobs
  • Hemisphere Energy Announces Normal Course Issuer Bid Renewal
  • Trump says US to impose 50% tariff on copper imports, copper futures jump
  • Canada maps out widening strait to LNG riches
  • Discount on Western Canada Select narrows

Return to Home
Alberta GasMonthly Avg.
CAD/GJ
Market Data by TradingView

    Report Error


    Note: The page you are currently on will be sent with your report. If this report is about a different page, please specify.

    About
    • About BOEReport.com
    • In the News
    • Terms of Use
    • Privacy Policy
    • Editorial Policy
    Resources
    • Widgets
    • Notifications
    • Daily Digest E-mail
    Get In Touch
    • Advertise
    • Post a Job
    • Contact
    • Report Error
    BOE Network
    © 2025 Stack Technologies Ltd.