CALGARY, ALBERTA–(Marketwired – Jan. 21, 2016) – Zargon Oil & Gas Ltd. (the “Company” or “Zargon”) (TSX:ZAR)(TSX:ZAR.DB) announces fourth quarter 2015 production volumes, provides a Little Bow Alkaline Surfactant Polymer (“ASP”) project update and announces 2015 year end reserves. Zargon intends to release its 2015 audited financial results on March 7, 2016, after market close.
2015 Fourth Quarter Production Volumes
Fourth quarter 2015 production averaged 3,635 barrels of oil and liquids per day, essentially unchanged from the preceding quarter rate of 3,633 barrels of oil and liquids per day. During the quarter, increased Little Bow ASP tertiary oil volumes offset declines from Zargon’s conventional properties.
Reflecting the economic shut-ins of minor non-operated natural gas properties, fourth quarter 2015 natural gas production averaged 4.23 million cubic feet per day, a 20 percent decline from the preceding quarter’s rate of 5.28 million cubic feet per day. Total production averaged 4,340 barrels of oil equivalent per day, a four percent decrease from the preceding quarter. During the quarter, oil and liquids production represented 84 percent of total production on a 6:1 equivalent basis.
Little Bow Alkaline Surfactant Polymer (“ASP”) Project Update
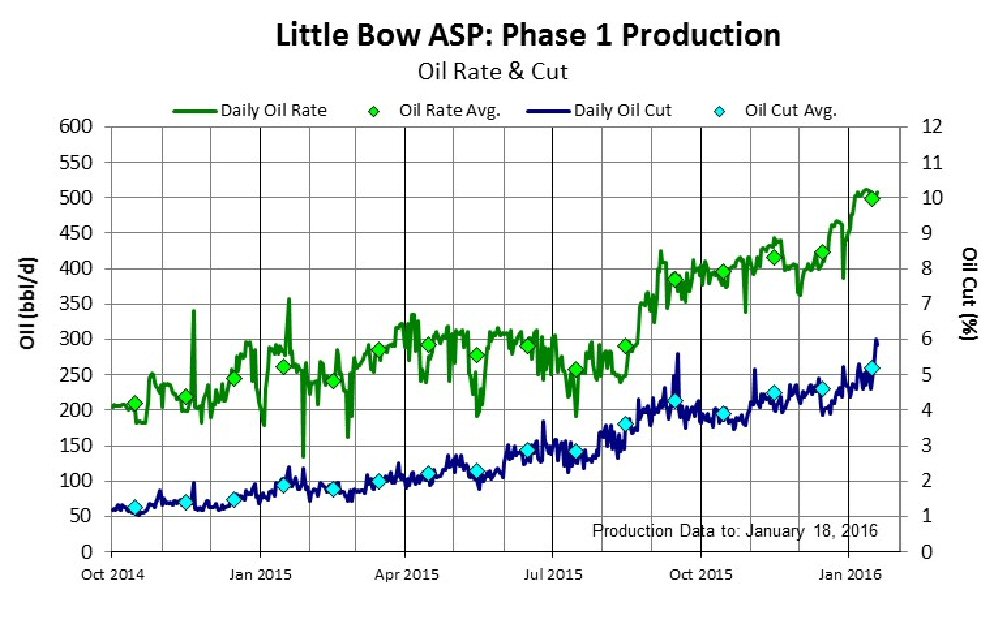
In March 2014, Zargon commenced chemical injection of large volumes of dilute chemical solution into the partially depleted Little Bow Mannville I pool to recover incremental oil reserves. To date, 6.6 million barrels of ASP solution has been injected into the first phase of the project. This injection volume is equal to about 20 percent of the targeted reservoir pore volume, and represents 29 percent of the total chemical bank (ASP and polymer only) scheduled to be injected in the phase 1 operation.
Last year, Zargon completed a summer-fall 2015 optimization and remedial program which included the conversion of two additional ASP injectors, multiple producer workovers, the drilling of three producing wells, and the replacement/repair of selected ASP injection lines. This program was followed with the drilling of three additional ASP producers prior to year end. Production results from these programs have been encouraging and show improved ASP project oil rates and oil cuts.
Consistent with our November 2015 production forecast, Zargon anticipates that the ASP project’s current oil cut and fluid production trends (provided graphically below) will take the total phase 1 production levels to more than 600 barrels of oil per day by the end of the 2016 second quarter (400 barrels per day of incremental ASP production plus 200 barrels per day of base waterflood production).
To view the graphic “Little Bow ASP: Phase 1 Production,” please visit the following link: http://media3.marketwire.com/docs/Zargon121.jpg
In their 2015 year end appraisal, Zargon’s independent reserves evaluator McDaniel & Associates Consultants Ltd., has recognized 4.48 million barrels of ultimate incremental tertiary proved and probable (producing and undeveloped) oil and liquids reserves to be recovered by the Little Bow ASP (Phase 1 and 2) project. For further information regarding the Little Bow ASP project, please refer to our updated corporate presentation which is available at www.zargon.ca.
2015 Capital Program
Zargon’s 2015 unaudited capital expenditures totaled approximately $25 million (excluding $0.6 million relating to final statement of adjustments for prior year dispositions) and was allocated 76 percent to the Little Bow ASP project with $12 million (unaudited) allocated to ASP chemical costs and $7 million (unaudited) to ASP exploitation costs.
The remaining $6 million (unaudited) of capital expenditures were allocated to minor waterflood and facility modifications that continue to enable Zargon to have an industry low base oil production decline of 13 percent per year. Zargon did not drill any conventional oil exploitation wells in 2015.
Zargon’s non-ASP conventional properties tend to be pressure supported by waterflood injections or natural reservoir aquifers and consequently provide long-life low-decline oil volumes. Approximately half of these production volumes are produced from Mississippian (Midale, Frobisher, Alida equivalent, Tilston) horizons in the Williston Basin core area. In aggregate, the conventional properties bring more than 75 horizontal locations that can be methodically drilled when oil prices improve. For further information regarding Zargon’s conventional drilling inventory, please refer to our updated corporate presentation which is available at www.zargon.ca.
2016 Outlook and Budget
Although we are encouraged by recent Little Bow technical performance, field oil prices have continued to deteriorate and 2016 stable corporate debt levels will not be achieved without further capital reductions. Fortunately, the Little Bow ASP project has advanced far enough that Alkaline and Surfactant (“AS”) injections can be suspended for a few months without significantly damaging future tertiary oil recoveries. Consequently, we have elected to temporarily suspend AS injections until oil prices improve materially ($45 US/bbl WTI target), although Polymer injections will be maintained to continue to move the formed oil banks to the producing wells. In the short term due to reservoir transit time, the suspension of AS injections will not have an impact on the ASP project’s production trends, but after six months we anticipate ASP production growth will subside, resulting in stable production volumes until AS injections are recommenced.
Assuming that AS injections are suspended from mid-February until the end of the year, Zargon’s 2016 capital budget will be reduced to $9 million and will comprise of $3 million of conventional expenditures, $1 million of ASP exploitation expenditures and $5 million for ASP chemical (mostly Polymer) costs. The 2016 drilling program does not anticipate the drilling of either conventional oil exploitation or Little Bow ASP wells.
Previously, Zargon has entered into an oil hedging program to provide a measure of stability and predictability to cash flows. For the first half of 2016, an average of 500 barrels per day is hedged at $79.30 Cdn/bbl WTI.
Production Guidance
In the November 11, 2015 third quarter results press release, Zargon provided 2015 fourth quarter oil production guidance of 3,650 barrels of oil and liquids per day (including incremental ASP volumes). Actual fourth quarter volumes essentially met guidance and were 3,635 barrels of oil and liquids per day and included 223 barrels of oil per day of incremental ASP oil production, up from 100 and 75 barrels of oil per day in the 2015 third and second quarters, respectively.
Reflecting the economic shut-ins of minor non-operated natural gas properties, Zargon’s fourth quarter natural gas production averaged 4.23 million cubic feet per day, lower than fourth quarter guidance levels of 5.00 million cubic feet per day. Approximately 93 percent of Zargon’s fourth quarter 2015 revenues were derived from oil and liquids sales.
Looking forward to 2016, increasing oil production volumes from the Little Bow ASP project are forecasted to mostly offset the effects of the 13 percent base decline from the conventional oil properties, and an average production rate of 3,550 barrels of oil per day is forecasted. This “no drilling” forecast assumes that in mid-February 2016, Little Bow AS chemical injections will be suspended for the remainder of the year. Significant oil production growth could be obtained in 2016 if a drilling budget was implemented. Natural gas volumes are forecasted to average 3.90 million cubic feet per day in 2016.
Strategic Alternatives Process Update
Last year, Zargon announced the formation of a Special Board Committee (“the Committee”) to examine alternatives that would maximize shareholder value in a manner that would recognize the Company’s fundamental inherent value related to Zargon’s long-life, low-decline conventional oil assets and the significant long term oil potential related to the Little Bow ASP project. Scotia Waterous Inc. is the financial advisor for the Committee.
This ongoing strategic and financial review might include, but is not limited to a strategic financing, merger or other business combination, sale of the Company or a portion of the Company’s business or assets or any combination thereof, as well as the continued execution of its business plan. The review will incorporate an analysis of market trends and tone. Zargon expects to provide updated disclosure regarding the strategic alternatives process prior to the end of the 2016 first quarter.
2015 YEAR END RESERVES:
- Zargon’s 2015 year end proved and probable total reserves decreased six percent to 20.90 million barrels of oil equivalent. These reserves were appraised by Zargon’s independent reserves evaluator McDaniel & Associates Consultants Ltd. (“McDaniel”) and are effective as of December 31, 2015. On a 6:1 equivalency basis, oil and liquids comprised 89 percent of Zargon’s total proved and probable reserves at year end 2015, up from an 88 percent weighting at the end of 2014.
- Zargon’s 2015 year end proved and probable oil and liquids reserves decreased six percent to total 18.58 million barrels. Zargon’s 2015 year end total proved oil and liquids reserves decreased six percent from 12.40 million barrels to total 11.67 million barrels.
- Zargon’s 2015 year end proved and probable natural gas reserves decreased 11 percent to total 13.90 billion cubic feet and Zargon’s year end total proved natural gas reserves decreased 14 percent to total 8.45 billion cubic feet.
- Zargon’s oil properties are characterized by pressure supported reservoirs (waterflood or natural aquifers) that provide long-life, low-decline oil production. Consequently, Zargon’s proved developed producing oil and liquids reserve life index is 7.1 years and Zargon’s proved and probable producing oil and liquids reserve life index is 9.2 years. Finally, Zargon’s total proved and probable oil and liquids reserve life index is 14.0 years. The relatively large developed producing reserve life indices are indicative of low decline rate oil production which supports Zargon’s business model.
- Zargon’s year end 2015 “produce-out” net asset value is calculated to be $4.84 per basic share. This reflects McDaniel’s estimate of the Zargon properties’ proved and probable future cash flow using a before tax 10 percent discount rate and forecast prices and costs plus an independent appraisal of Zargon’s undeveloped land less an allowance for the year end bank debt, the full future face value of the $57.5 million convertible debenture and working capital deficiencies.
DETAILED RESERVE INFORMATION:
Reserves included herein are stated on a gross company working interest basis unless otherwise noted. All reserves information has been prepared in accordance with National Instrument 51-101 Standards of Disclosure (“NI 51-101”). In addition to the detailed information disclosed in this press release, more detailed information will be included in Zargon’s 2015 Annual Information Form to be filed on SEDAR (www.sedar.com) and posted on our website (www.zargon.ca) in March 2016.
Based on the independent reserves evaluation conducted by McDaniel effective December 31, 2015, and prepared in accordance with NI 51-101, Zargon had proved and probable reserves of 20.90 million barrels of oil equivalent.
| Company Reserves(1) | |||
| At December 31, 2015 | Oil and Liquids (mmbbl) |
Natural Gas (bcf) |
Equivalents (2) (mmboe) |
| Proved producing | 9.41 | 6.14 | 10.44 |
| Proved non-producing | 0.19 | 2.00 | 0.52 |
| Proved undeveloped | 2.07 | 0.31 | 2.12 |
| Total proved | 11.67 | 8.45 | 13.08 |
| Probable additional producing | 2.81 | 2.18 | 3.16 |
| Probable non-producing and undeveloped | 4.10 | 3.27 | 4.66 |
| Total probable additional | 6.91 | 5.45 | 7.82 |
| Total proved and probable producing | 12.22 | 8.32 | 13.60 |
| Total proved and probable | 18.58 | 13.90 | 20.90 |
| Proved producing reserve life index, years (3) | 7.1 | 4.0 | 6.6 |
| Proved reserve life index, years (3) | 8.8 | 5.5 | 8.3 |
| Proved and probable producing reserve life index, years (3) | 9.2 | 5.4 | 8.6 |
| Proved and probable reserve life index, years (3) | 14.0 | 9.0 | 13.2 |
- Company working interest reserves are gross reserves before deduction of royalties, boe (6:1).
- Boes may be misleading, particularly if used in isolation. A boe conversion ratio of 6 mcf:1 bbl is based on an energy equivalency conversion method primarily applicable at the burner tip and does not represent a value equivalency at the wellhead.
- Reserve life is calculated using annualized fourth quarter 2015 production.
A reconciliation summary of the 2015 year end reserve assignments with the reserves reported in the 2014 year end report based on McDaniel’s forecast prices and costs is presented below:
| Reserve Reconciliation (All Categories) | ||||||||||||||||||
| Oil and Liquids (mmbbl) | Natural Gas (bcf) | Equivalents (mmboe) | ||||||||||||||||
| Proved | Probable | Proved & Prob. |
Proved | Probable | Proved & Prob. |
Proved | Probable | Proved & Prob. |
||||||||||
| December 31, 2014 | 12.40 | 7.27 | 19.67 | 9.85 | 5.84 | 15.69 | 14.05 | 8.24 | 22.29 | |||||||||
| Discoveries and extensions | 0.19 | 0.09 | 0.28 | 0.02 | – | 0.02 | 0.19 | 0.10 | 0.29 | |||||||||
| Revisions | 0.44 | (0.45 | ) | (0.01 | ) | 0.41 | (0.39 | ) | 0.02 | 0.51 | (0.52 | ) | (0.01 | ) | ||||
| Acquisitions and dispositions | – | – | – | – | – | – | – | – | – | |||||||||
| Production | (1.36 | ) | – | (1.36 | ) | (1.83 | ) | – | (1.83 | ) | (1.67 | ) | – | (1.67 | ) | |||
| December 31, 2015 | 11.67 | 6.91 | 18.58 | 8.45 | 5.45 | 13.90 | 13.08 | 7.82 | 20.90 | |||||||||
On a total proved basis, Zargon added 0.63 million barrels of oil and liquids from revisions and field activities. For total proved natural gas reserves, Zargon added 0.43 billion cubic feet from revisions and field activities. On a combined basis, Zargon’s 2015 total proved net reserve additions increased by 0.70 million barrels of oil equivalent as a result revisions and field activity. The McDaniel year over year change in the future proved development capital was a $1.6 million reduction ($43.8 million at December 31, 2015, compared with $45.4 million at December 31, 2014).
On a total proved and probable basis, Zargon added 0.27 million barrels of oil and liquids from revisions and field activities. Total proved and probable natural gas reserves increased from the prior year by 0.04 billion cubic feet. On a combined basis, Zargon’s 2015 total proved and probable net reserve additions resulted in an increase of 0.28 million barrels of oil equivalent. The McDaniel year over year changes in the future proved and probable development capital was an $8.5 million increase ($112.1 million at December 31, 2015, compared with $103.6 million at December 31, 2014).
| Reserve Reconciliation (Developed Producing) | ||||||||||||||||||
| Oil and Liquids (mmbbl) | Natural Gas (bcf) | Equivalents (mmboe) | ||||||||||||||||
| Proved | Probable | Proved & Prob. |
Proved | Probable | Proved & Prob. |
Proved | Probable | Proved & Prob. |
||||||||||
| December 31, 2014 | 10.05 | 3.33 | 13.38 | 8.71 | 2.80 | 11.51 | 11.50 | 3.79 | 15.29 | |||||||||
| Discoveries and extensions | – | – | – | – | – | – | – | – | – | |||||||||
| Revisions | 0.72 | (0.52 | ) | 0.20 | (0.74 | ) | (0.62 | ) | (1.36 | ) | 0.61 | (0.63 | ) | (0.02 | ) | |||
| Acquisitions and dispositions | – | – | – | – | – | – | – | – | – | |||||||||
| Production | (1.36 | ) | – | (1.36 | ) | (1.83 | ) | – | (1.83 | ) | (1.67 | ) | – | (1.67 | ) | |||
| December 31, 2015 | 9.41 | 2.81 | 12.22 | 6.14 | 2.18 | 8.32 | 10.44 | 3.16 | 13.60 | |||||||||
Zargon’s reserves are characterized by a high developed producing component and a corresponding high confidence level. Proved developed producing reserves represent 80 percent of total proved reserves and 50 percent of the total proved and probable reserves. The remaining Little Bow ASP project reserves of 4.29 million barrels of oil equivalent represents 59 percent of Zargon’s total proved and probable undeveloped and non-producing reserves of 7.30 million barrels of oil equivalent.
NET ASSET VALUE:
Zargon’s oil, liquids and natural gas reserves were evaluated using McDaniel’s price forecasts effective January 1, 2016, prior to provisions for income taxes, interest, debt service charges, transaction costs and general and administrative expenses. The estimated values of future net revenue disclosed do not represent the fair market value of the reserves.
| Before Tax Present Value of Future Net Revenue | ||||
| (Forecast Prices and Costs) | ||||
| Discount Factor | ||||
| ($ millions) | 0% | 5% | 10% | 15% |
| Proved producing | 230.0 | 181.1 | 146.5 | 122.4 |
| Proved non-producing | 7.3 | 5.4 | 4.1 | 3.3 |
| Proved undeveloped | 32.0 | 24.1 | 17.5 | 12.2 |
| Total proved | 269.3 | 210.6 | 168.1 | 137.9 |
| Probable additional producing | 106.2 | 61.0 | 39.3 | 27.7 |
| Probable additional non-producing and undeveloped | 125.7 | 80.4 | 51.9 | 33.6 |
| Total probable additional | 231.9 | 141.4 | 91.2 | 61.3 |
| Total proved and probable producing | 336.2 | 242.1 | 185.8 | 150.1 |
| Total proved and probable | 501.2 | 352.0 | 259.3 | 199.2 |
The following net asset value table shows what is customarily referred to as a “produce-out” net asset value calculation under which the current value of Zargon’s reserves would be produced at McDaniel’s forecast future prices and costs. The value is a snapshot in time as at December 31, 2015, and is based on various assumptions including commodity prices and foreign exchange rates that vary over time. In this analysis, the present value of the proved and probable reserves is calculated at a before tax 10 percent discount rate. In the net asset value calculation, Zargon’s 75 thousand net acres of land is valued at $9.3 million based on the independent firm of Seaton-Jordan & Associates Ltd. valuation as at December 31, 2015.
| Net Asset Value | ||
| As at December 31 ($ millions) | 2015 | |
| Proved and probable reserves (PVBT 10%) (1) | 259 | |
| Undeveloped land | 9 | |
| Working capital (excluding unrealized derivative assets/liabilities) – unaudited | (3 | ) |
| Bank debt – unaudited | (60 | ) |
| Convertible debenture – unaudited | (58 | ) |
| Net asset value | 147 | |
| Net asset value per share ($/basic share) (2) | 4.84 | |
- McDaniel’s estimate of future before tax cash flow discounted at PV 10 percent.
- Calculated using basic total shares outstanding at December 31, 2015 of 30.366 million shares.
The following table provides net asset value estimates at December 31, 2015 for all four reserve categories.
| Reserves Category | McDaniel PVBT 10% ($ million)(1) |
Net Asset Value ($ million)(2) |
Net Asset Value ($/basic share)(3) |
| Proved, developed, producing reserves | 147 | 35 | 1.15 |
| Total proved reserves | 168 | 56 | 1.84 |
| Proved and probable, developed producing reserves | 186 | 74 | 2.44 |
| Proved and probable reserves | 259 | 147 | 4.84 |
- McDaniel’s estimate of future before tax cash flow discounted at PV 10 percent.
- McDaniel’s estimated value, adjusted for the following unaudited items at December 31, 2015:
- Undeveloped land value as assessed by Seaton-Jordan of $9.3 million; and
- Net debt of $121 million, which includes full value of the convertible debenture of $57.5 million.
- Calculating using basic total shares outstanding at December 31, 2015 of 30.366 million shares.
McDaniel & Associates Consultants Ltd. Price Forecast (effective January 1, 2016)
| WTI Crude Oil $US/bbl |
Edmonton Light Crude Oil $C/bbl |
Alberta Bow River Hardisty Crude Oil $C/bbl |
Western Canadian Select Crude Oil $C/bbl |
Alberta Heavy Crude Oil $C/bbl |
Sask Cromer Medium Crude Oil $C/bbl |
U.S. Henry Hub Gas Price $US/MMBtu |
Alberta AECO Spot Price $C/MMBtu |
US/CAN Exchange Rate $US/$CAN |
|
| 2016 | 45.00 | 56.60 | 47.00 | 46.40 | 40.50 | 52.60 | 2.50 | 2.70 | 0.730 |
| 2017 | 53.60 | 66.40 | 55.10 | 54.40 | 47.50 | 61.80 | 2.95 | 3.20 | 0.750 |
| 2018 | 62.40 | 72.80 | 60.40 | 59.70 | 52.10 | 67.70 | 3.40 | 3.55 | 0.800 |
| 2019 | 69.00 | 80.90 | 67.10 | 66.30 | 57.80 | 75.20 | 3.70 | 3.85 | 0.800 |
| 2020 | 73.10 | 83.20 | 69.10 | 68.20 | 59.50 | 77.40 | 3.90 | 3.95 | 0.825 |
| 2021 | 77.30 | 88.20 | 73.20 | 72.30 | 63.10 | 82.00 | 4.15 | 4.20 | 0.825 |
| 2022 | 81.60 | 93.30 | 77.40 | 76.50 | 66.70 | 86.80 | 4.35 | 4.45 | 0.825 |
| 2023 | 86.20 | 98.70 | 81.90 | 80.90 | 70.60 | 91.80 | 4.60 | 4.70 | 0.825 |
| 2024 | 87.90 | 100.70 | 83.60 | 82.60 | 72.00 | 93.70 | 4.70 | 4.80 | 0.825 |
| 2025 | 89.60 | 102.60 | 85.20 | 84.10 | 73.40 | 95.40 | 4.80 | 4.90 | 0.825 |
| 2026 | 91.40 | 104.70 | 86.90 | 85.90 | 74.90 | 97.40 | 4.90 | 5.00 | 0.825 |
| 2027 | 93.30 | 106.90 | 88.70 | 87.70 | 76.40 | 99.40 | 5.00 | 5.10 | 0.825 |
| 2028 | 95.10 | 108.90 | 90.40 | 89.30 | 77.90 | 101.30 | 5.10 | 5.20 | 0.825 |
| 2029 | 97.00 | 111.10 | 92.20 | 91.10 | 79.40 | 103.30 | 5.20 | 5.30 | 0.825 |
| 2030 | 99.00 | 113.40 | 94.10 | 93.00 | 81.10 | 105.50 | 5.30 | 5.40 | 0.825 |
| Thereafter | +2%/yr | +2%/yr | +2%/yr | +2%/yr | +2%/yr | +2%/yr | +2%/yr | +2%/yr | 0.825 |