In building a price forecast, any single indicator, including forward curves, is usually a poor predictor of future spot prices. It is important to consider a wide variety of information when building a spot price forecast. In general, all price forecasts are wrong – the goal is to be less wrong more often and have a body of supporting information to justify each forecast. In the oil and gas industry, one of the primary uses of price forecasts is to provide a reasonable basis for the valuation of oil and gas assets.
These were insights I gleaned from a conversation with Tyler Schlosser, Director of Commodities Research, GLJ Petroleum Consultants. I asked Tyler about the cautions and considerations he takes when looking at Forward Curves in the process of building the GLJ price forecast. Here is what Tyler had to say:
“Oil and gas futures, or forward curves, are not true spot price forecasts. In addition to market expectations of future spot prices, other factors influence futures prices. Some of these factors are:
- interest rates
- inflation expectations
- storage costs and availability
- insurance
- hedging effects
- liquidity – can the contracts be easily bought and sold at sufficient volumes?
- rapid speculative position accumulation or unwinding (e.g., sudden widespread short-covering)
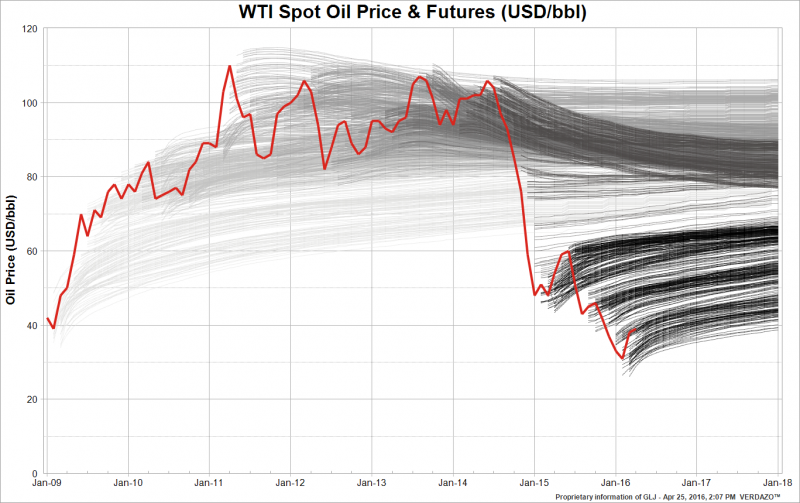
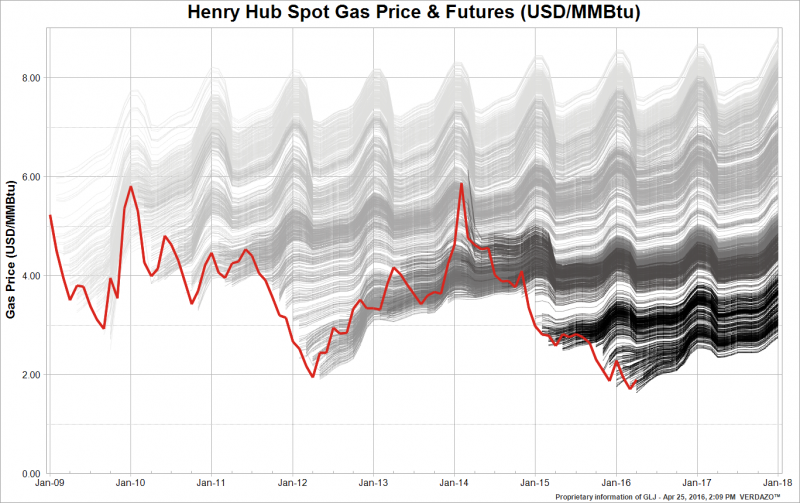
In the VERDAZO-generated charts, it’s easy to see that forward curves have certainly not been excellent predictors of spot prices. It’s also easy to see that the forward curves at any point in time often share a relatively consistent slope, which is primarily due to some of the factors listed above, and does not represent a true spot price forecast. On the WTI crude futures chart (above), this is especially apparent throughout 2015, where the forward curves moved down in a parallel fashion as spot prices fell throughout the year. The Henry Hub gas futures chart (below) shows the strength of the seasonal effects (higher prices in winter delivery months) and the consistent shallow upward slope that primarily reflects storage and financing costs.”
About the charts in this blog
The charts in this blog show the average monthly spot price (the red line) and the futures, or forward curves (in shades of grey through black). On a given transaction date (the forward curve generally starts a month or two after this), the forward curve provides the agreed-upon contract prices for future delivery dates. The monthly forward curves get darker in shade as the transaction date gets closer to the present (e.g. 2009 futures are light grey while 2016 futures are black).
Price data: GLJ Petroleum Consultants
Analysis: VERDAZO
Thanks for reading. This was originally posted as a VERDAZO blog. We welcome your questions and suggestions for future blogs.
Bertrand is the President of Verdazo Analytics (formerly Visage Information Solutions). Over a 25-year career, Bertrand has worked in over 11 countries developing software solutions to help companies make smarter, faster decisions through visual data analytics. Read more of Bertrand’s insightful blogs here.