Planning for the second half of the year is challenging for operators and service companies. Suppliers are trying to understand how demand will change for product and services. The industry is monitoring, watching, and clinging to oil prices, rig counts, and other industry metrics closely. Market signals show negative and positive signs depending on the interpretation. In the last several weeks, operators putting rigs to work is a positive sign for oilfield service and driller contractors.
The latest Baker Hughes rig count showed an increase of 4.6% to 435 active rigs across the United States. The summer months this year brought heat and 5 straight weeks of rig count increases. The vocal E&P’s leading the shale and energy independence charge announced plans to reduce their drilled uncompleted backlog of wells and to begin adding rigs as oil approached $50 per barrel. However, the market is volatile and unpredictable. West Texas Intermediate (WTI) price responded by falling 11% month to date in July.
At the beginning of this year, on January 1, there were 661 rigs and West Texas Intermediate (WTI) closed the prior day at $37.04 per barrel. The Lower 48 shale plays seemed resilient considering 2015 instability. The active rigs were concentrated in the core areas of each play. As of July 22, 2016, the US rig count is 435, a 34% decline since the beginning of the year.
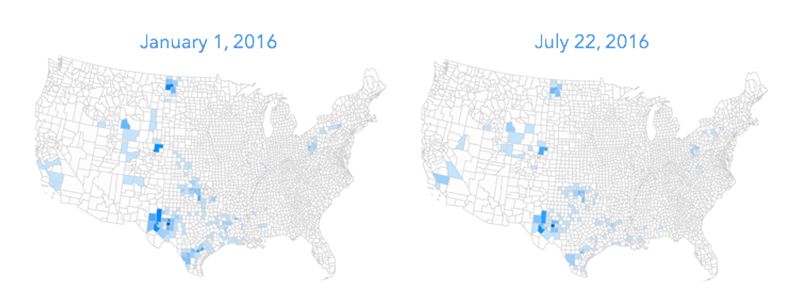
It was less than 6 months ago that WTI dropped to $26.21, the low for this down cycle. The industry responded with weeks of rig count reduction as operators terminated contracts and released rigs. The Permian pad-capable rigs were the last rigs standing. Eagle Ford and Bakken saw rig counts sliced in half as oil moved back into the $40’s.
A stronger second quarter for natural gas took Henry Hub prices from $1.63 to $2.50 Mcf. Some operators were able to respond quickly putting rigs back to work in Marcellus and Haynesville.
The table highlights the top shale plays and the year to date changes in rig count.
| January 1, 2016 | July 22, 2016 | Change | |
| Permian | 217 | 168 | -23% |
| Eagle Ford | 76 | 35 | -54% |
| Bakken | 53 | 27 | -49% |
| Marcellus | 41 | 23 | -44% |
| Cana Woodford | 38 | 28 | -26% |
| Haynesville | 25 | 16 | -36% |
| DJ-Niobrara | 23 | 18 | -22% |
Questions remain for second half of 2016
Was the WTI too bullish? Have the bears now taken over? Did the market rebalance? How many more E&P companies will go bankrupt? Will operators and oilfield service companies sustain 400 rigs at $40 per barrel crude? This lower priced environment raises many questions as companies prepare for the second half of 2016 and beginning of 2017.
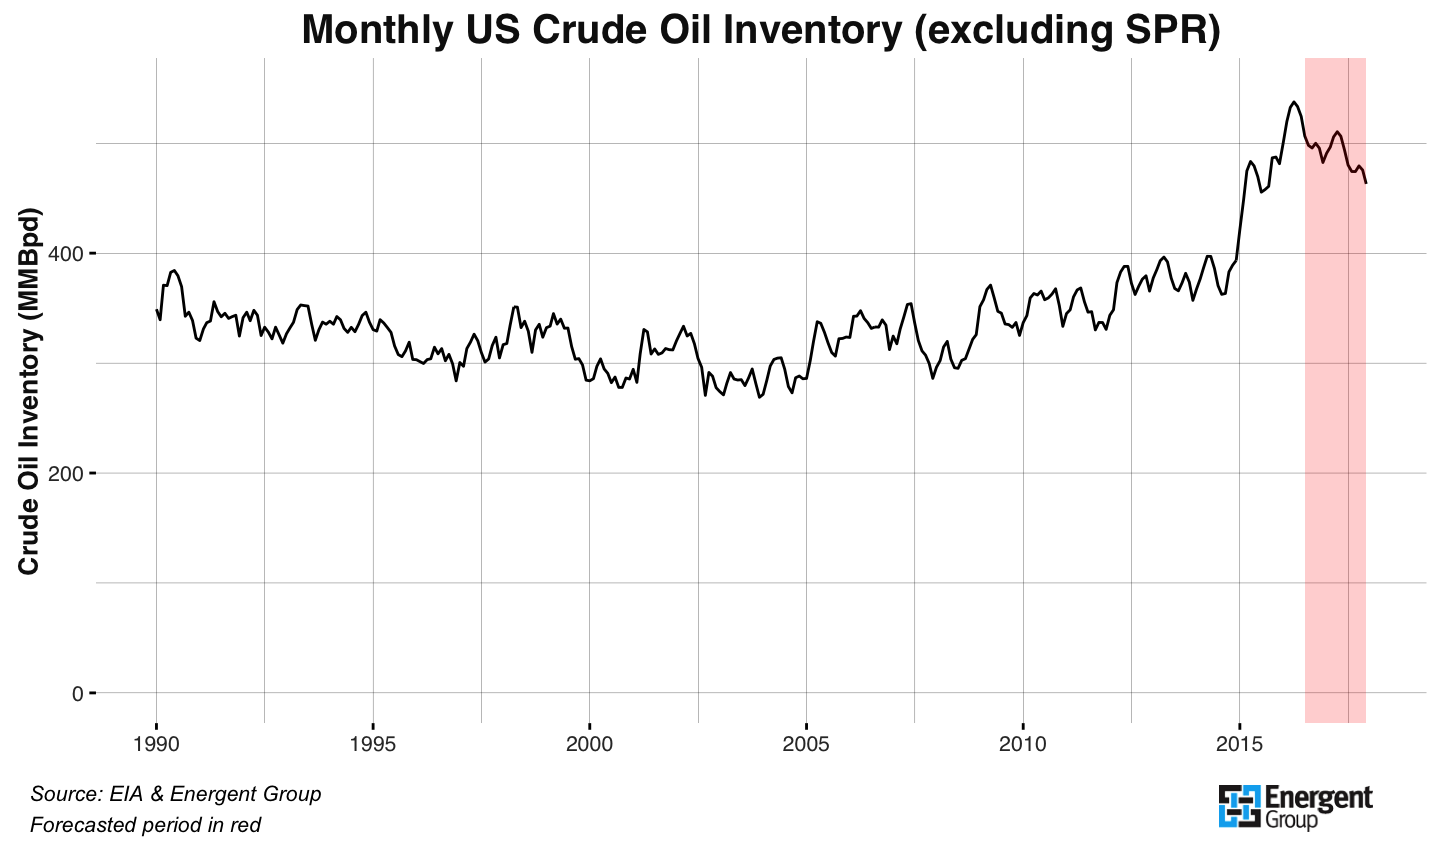
When will inventory declines impact crude prices?
As production volumes turned over across key US shale plays, many expected oil inventories to decline sharply. Data supplied by the Energy Information Association (EIA) shows a forecasted decline; however, crude inventories remain at record levels.
Where is the ‘normal’ backlog for oil DUCs?
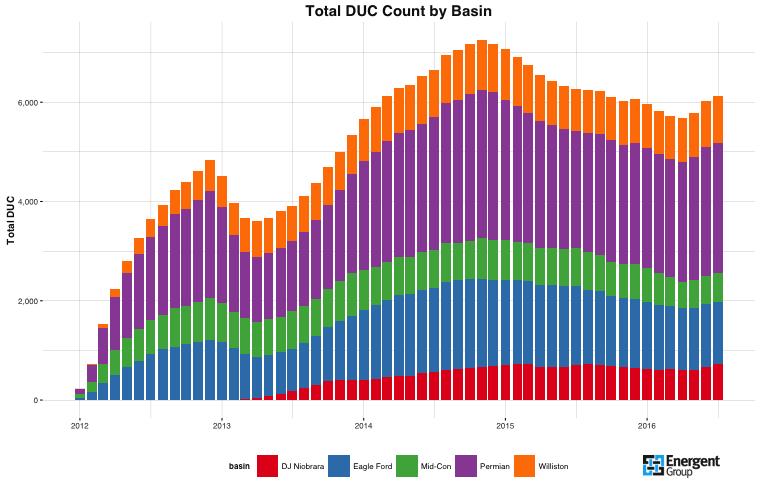
Operators reduced large inventories of uncompleted wells in 2015. Most, if not all, put drilling programs on hold until a more favorable oil price environment. Since the start of April 2016, the inventory of drilled uncompleted wells has increased after the draw down in 2015.
This shows the apprehensiveness of operators to continue to complete wells while oil prices remain in the $40 range. According to EIA’s forecast, WTI will remain below $50 in 2016 and not rise above $50 until early 2017. Expect the DUC inventory to stay near the current level until operators have confidence to bring new wells online. As operators begin to shape plans to frac and complete the wells, the dispersed frac crews and stagnate equipment may prove dispersed)
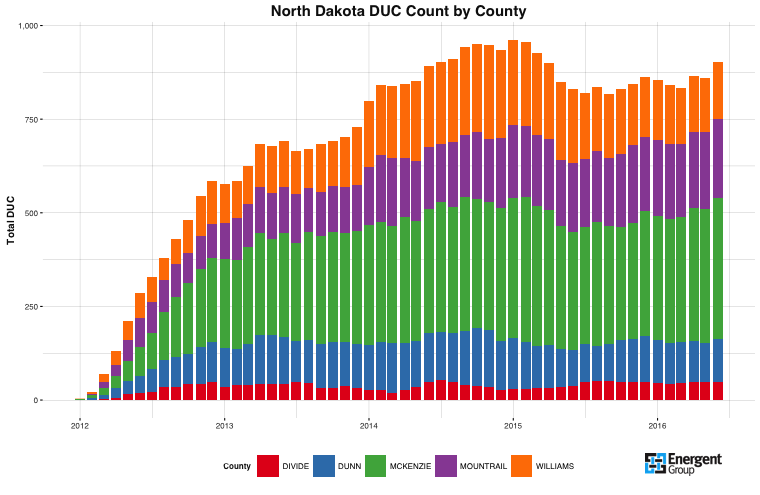
For instance, areas of the Permian, Eagle Ford, and Bakken where DUC concentration is high will pose supplier challenges. McKenzie, often consider near the core of Bakken, has the most DUCs in North Dakota. The chart below shows a more detailed view of the uncompleted well count in North Dakota, showing the top five counties holding uncompleted inventories.
Planning in this volatile environment is difficult at best. The market sentiment is unpredictable with continued emphasis on supply and demand economics. The macroeconomic will help give you different scenarios, but using a data-driven, evidence based plan created from a bottoms-up view will give you an intimate view of today’s market. Are you ready for the second half of 2016?
Sign-up for Energent Group’s weekly insights to find the answers you need