The leadership of many oil & gas producers can greatly widen the use of predictive analytics to achieve value from the data their company collects and manages.
After defining what predictive analytics is, I’ll illustrate how predictive analytics achieves business value for oil & gas producers through the following five common upstream oil & gas industry use cases along the well life cycle:
- Reducing exploration risk.
- Creating development scenarios.
- Controlling drilling and completion costs.
- Improving production operations.
- Evaluating acquisition and divestiture opportunities.
Predictive Analytics
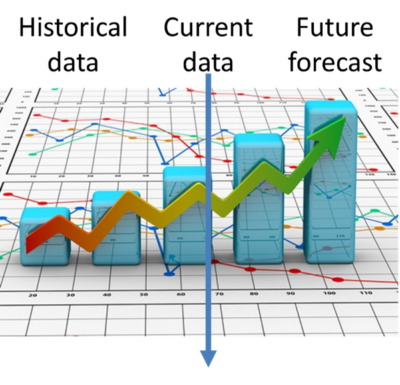
Predictive analytics encompasses a variety of statistical techniques including predictive modeling, machine learning, and data mining to analyze current and historical facts to make predictions about future or otherwise unknown events.
 Predictive analytics exploits patterns found in historical and transactional data to identify risks and opportunities. Models capture relationships among many variables to allow assessment of risk or potential that is associated with a particular set of conditions.
The goal of predictive analytics is to guide decision-making and reduce the risk of making investments that turn out to be unprofitable.
I’ll clarify the relationship among some similar terms that are sometimes used as synonyms when they are not:
- Predictive analytics always includes a forecast component.
- Data analytics typically focuses only on historic and current data.
- Visual analytics focuses on the superior presentation of data as charts and may or may not include a forecast component.
Reducing exploration risk
Reducing exploration risk requires a 3D earth model for the area of interest. The earth model is about predicting:
- Where the structures that contain oil & gas are located.
- The approximate volumes of producible hydrocarbon that are contained in the structures.
In this sub-surface visualization, we are enhancing our sub-surface understanding by integrating seismic data with well logs.

Creating development scenarios
Once we’ve forecasted the approximate resources in place, we move on to creating development scenarios.
Below is a visualization of a multi-field oil & gas development scenario located east of Warri, an oil hub in South Nigeria.

In a predictive analytics application, you can click on the various graphic elements and either drill into the data or at least reveal some summary data. It’s also easy to move elements like plants, pipelines, and roads around as you evaluate multiple scenarios.
Often the pictorial representation is a map layer in a GIS application. Zooming in will reveal more detail such as roads, rivers, batteries, well pads, and eventually individual wells.
Predictive analytics can be used to aggregate a huge amount of data to produce one or more scenarios.
Controlling drilling and completion costs
Once we’ve forecasted the implications of alternative development scenarios, we move on to drilling and completing wells.
This net revenue forecast seeks to determine if investing in more expensive fracturing fluids, such as nitrogen, results in higher cumulative net revenue. Notice that every circle is at least a little higher than every X suggesting the more expensive nitrogen produced a positive net revenue increment compared to water.

In the data visualization, you can right-click on every symbol to display some more information about the well characteristics such as the:
- Number of frac stages.
- Distance between frac stages.
- Frac fluid volume injected.
- Frac pressure profile.
There are enough variables at play here that predictive analytics can make a valuable contribution to better understanding the specific opportunities to improve completion outcomes.
Improving production operations
Once we’ve completed all the planned wells, we move on to improving production operations at the wells.
Downtime analysis is a huge focus for production engineers. The predictive aspect of this downtime analysis is a calculated production volume capability for each well.
The goal of this analysis is to understand the:
- Sources of downtime to intervene for more up-time into the future.
- Production volume impact of downtime that is expressed by the vertical length of the histogram.

The historic aspects of this downtime analysis allow the end-user to:- Scroll across various time periods.
- Drill in by downtime reason codes.
- Drill in by well status, field and pool.
I like how the data is concurrently displayed as a chart and as a map. Problem diagnosis is often aided by understanding the spatial relationships among wells.
I like the ability to select low downtime wells. Our diagnostic focus should not just be on poorly performing wells. We should also apply learning from superior performing wells to similar wells that are not performing as well.
Predictive analytics helps us understand well performance and triggers ideas for how to manage it better.Evaluating acquisition and divestiture opportunities
After producing the wells for a period, we often move on to evaluating acquisition and divestiture opportunities.
This operations execution dashboard displays how quickly investment capital for drilling and completion turns into revenue. The values for speed to revenue help us evaluate the overall net revenue potential of a field or an area and thereby influence the sale price.

Predictive analytics responds to the relentless pressure all oil and gas producers face to increase return on capital and to reduce operating costs.