For the second entry in our two-part Q4 2022 Earnings Season Report Card, we’ve focused on cost structures and netbacks (see part 1 here). Our analysis has shown that Q4 2022 was a productive period for gas-heavy producers, many of which were able to take advantage of then favourable movements in natural gas prices as winter set in. Inflation exerted upward pressure on operating and transportation costs, although these effects were distributed unevenly between the two. We have prepared summary tables for these metrics across the companies in our dataset, which can be accessed in full on the BOE Intel platform.
1. Operating Costs
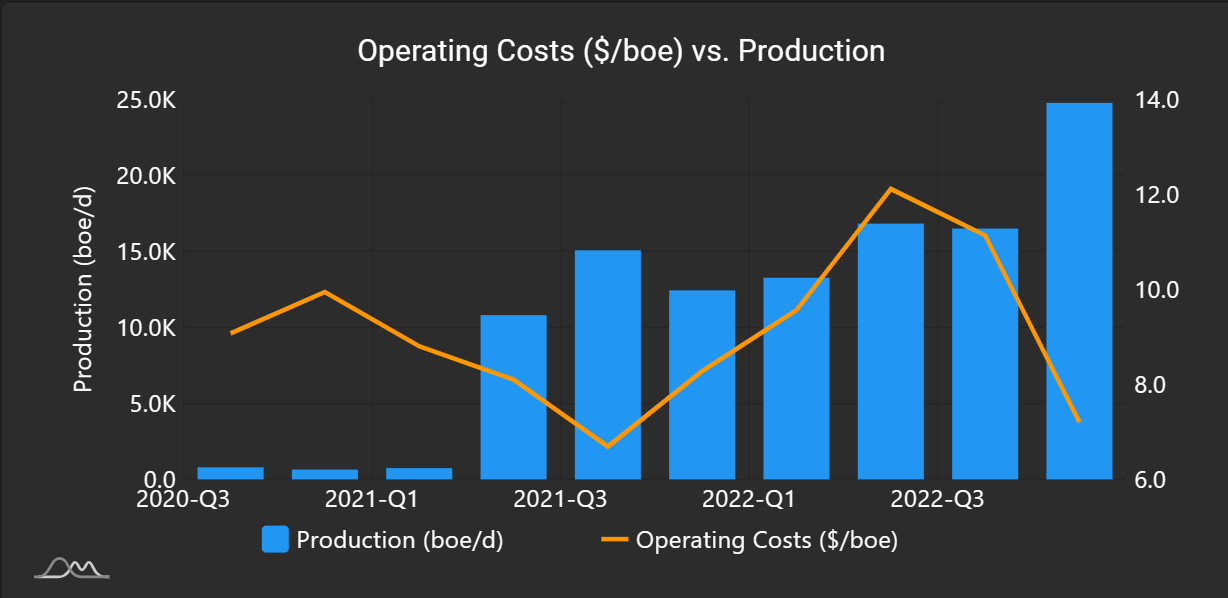
Inflationary pressures continue to influence operating costs, but showed signs of levelling out in Q4 with median operating costs declining by 0.7% compared to Q3. Roughly half of the companies we assessed saw reductions in per-barrel operating costs, with Kiwetinohk leading the way in Q4 after reducing its operating costs by 35.3% compared to Q3. Kiwetinohk referenced increased production levels that enabled the company to take advantage of economies of scale, as well as normalized operating activities in the fourth quarter. Other companies that substantially reduced their operating costs include Petrus Resources (- 19.0%) and Crew Energy (- 14.6%). As was the case with Kiwetinohk, Petrus Resources’ impressive per-barrel operating cost reduction was accomplished through taking advantage of economies of scale related to increased production. Crew Energy’s reduced per-barrel operating costs were the result of new production in the company’s West Septimus and Groundbirch assets, which yield comparatively lower per-unit operating expenses.
| Company | Q3 Operating Costs ($/BOE) | Q4 Operating Costs ($/BOE) | % Change |
|---|---|---|---|
| Kiwetinohk | 11.13 | 7.2 | -35.3 |
| Petrus Resources | 8.47 | 6.86 | -19 |
| Crew Energy | 4.34 | 3.7 | -14.6 |
| Cenovus | 10.87 | 9.59 | -11.8 |
| Baytex | 14.39 | 13.06 | -9.2 |
| Advantage Energy | 3.72 | 3.39 | -8.9 |
| Enerplus | 10.47 | 9.68 | -7.5 |
| Ovintiv | 6.06 | 5.61 | -7.4 |
| Athabasca | 17.96 | 16.73 | -6.8 |
| ARC Resources | 4.69 | 4.37 | -6.8 |
| Pieridae | 17.36 | 16.24 | -6.5 |
| Whitecap | 14.85 | 14.13 | -4.8 |
| Pipestone | 13.48 | 12.87 | -4.5 |
| Crescent Point | 15.12 | 14.5 | -4.1 |
| Cardinal Energy | 27.53 | 26.42 | -4.1 |
| NuVista | 12.23 | 11.94 | -2.4 |
| Spartan Delta | 8.79 | 8.64 | -1.7 |
| Tourmaline | 4.36 | 4.38 | 0.5 |
| Vermilion | 16.64 | 16.81 | 1 |
| Gear Energy | 21.16 | 21.55 | 1.8 |
| Tamarack Valley | 10.67 | 10.88 | 1.9 |
| Lucero | 9.06 | 9.32 | 2.9 |
| Obsidian Energy | 15.9 | 16.43 | 3.4 |
| Kelt Exploration | 10.52 | 10.9 | 3.6 |
| MEG Energy | 10.61 | 11.05 | 4.1 |
| Headwater | 5.95 | 6.25 | 5 |
| Peyto | 2.26 | 2.44 | 8 |
| Surge Energy | 20.46 | 22.1 | 8 |
| Yangarra | 6.26 | 6.77 | 8.1 |
| Paramount | 12.25 | 13.31 | 8.7 |
| Journey | 23.09 | 25.3 | 9.6 |
| Pine Cliff | 12.03 | 13.49 | 12.1 |
| Birchcliff | 3.5 | 4.06 | 16 |
| InPlay Oil | 12.53 | 14.78 | 18 |
| Canadian Natural Resources | 12.68 | 15.17 | 19.6 |
| Bonterra Energy | * | * | * |
| Imperial Oil | * | * | * |
| Suncor Energy | * | * | * |
| MEDIAN | 11.13 | 11.05 | -0.7 |
* Data unavailable
KIWETINOHK OPERATING COSTS
2. Transportation Costs
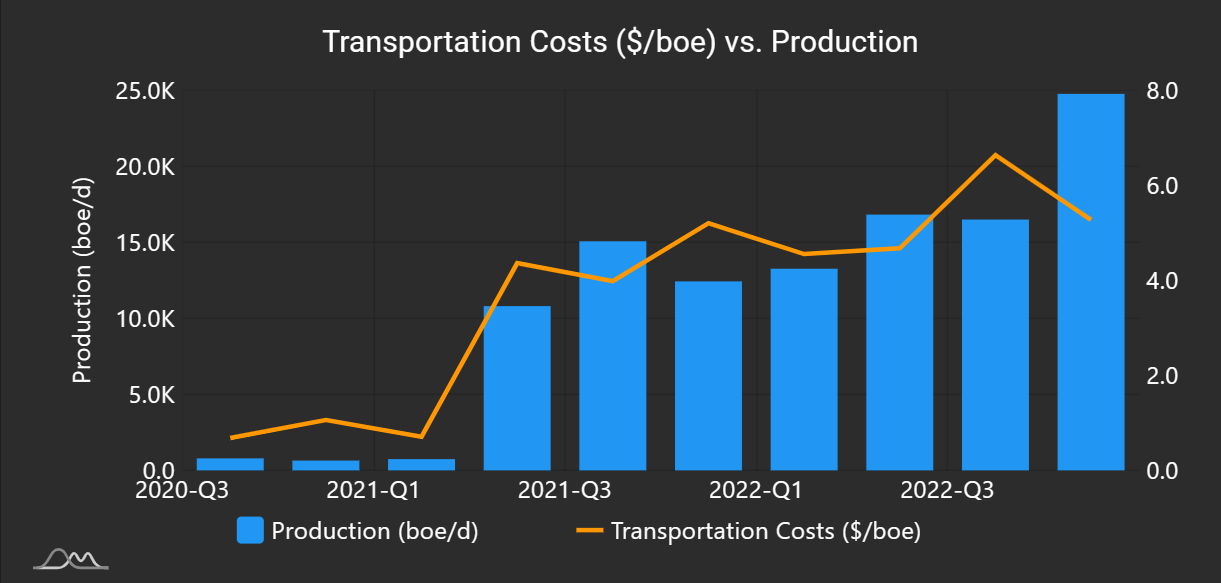
Inflation had a larger impact on transportation costs, with the median per-barrel transportation cost increasing by 3.1% in Q4. Just under a third of companies reported decreased transportation costs in Q4, however, with Kiwetinohk leading the group by achieving a 20.5% reduction. As was the case with its reduced operating costs above, economies of scale from increased production were the primary downward influence. This was driven in part by the company’s long-term contracts with transportation providers, which kept costs relatively consistent. Other strong performers include Peyto (- 12.9%) and Whitecap (- 6.6%). Peyto’s per-barrel transportation costs dropped largely on account of fee developments on the Emerson transportation service, which were elevated earlier in the year. Similarly to Kiwetinohk, Whitecap’s transportation cost per barrel declined on account of increased economies of scale from expanded production combined with consistent transportation service contracts.
| Company | Q3 Transportation ($/BOE) | Q4 Transportation ($/BOE) | % Change |
|---|---|---|---|
| Kiwetinohk | 6.63 | 5.27 | -20.5 |
| Peyto | 1.55 | 1.35 | -12.9 |
| Whitecap | 2.27 | 2.12 | -6.6 |
| ARC Resources | 6.08 | 5.7 | -6.3 |
| Kelt Exploration | 3.22 | 3.03 | -5.9 |
| Lucero | 1.87 | 1.77 | -5.3 |
| Spartan Delta | 2.88 | 2.76 | -4.2 |
| Enerplus | 4.16 | 4.04 | -2.9 |
| Advantage Energy | 4.48 | 4.43 | -1.1 |
| Birchcliff | 5.41 | 5.37 | -0.7 |
| Ovintiv | 11.74 | 11.92 | 1.6 |
| Pine Cliff | 1.39 | 1.42 | 2.2 |
| Pipestone | 3.42 | 3.51 | 2.6 |
| Obsidian Energy | 3.18 | 3.28 | 3.1 |
| Athabasca | 7.09 | 7.36 | 3.8 |
| Crew Energy | 3.42 | 3.56 | 4.1 |
| NuVista | 5.12 | 5.33 | 4.1 |
| Canadian Natural Resources | 3.64 | 3.8 | 4.4 |
| Cardinal Energy | 0.83 | 0.87 | 4.8 |
| Vermilion | 2.57 | 2.71 | 5.4 |
| Crescent Point | 2.93 | 3.09 | 5.5 |
| Yangarra | 1.15 | 1.22 | 6.1 |
| Headwater | 3.94 | 4.21 | 6.9 |
| Surge Energy | 1.3 | 1.4 | 7.7 |
| Tourmaline | 4.66 | 5.08 | 9 |
| Gear Energy | 3.67 | 4.03 | 9.8 |
| Petrus Resources | 1.89 | 2.08 | 10.1 |
| Baytex | 1.67 | 1.85 | 10.8 |
| Journey | 0.73 | 0.86 | 17.8 |
| Cenovus | 7.01 | 8.57 | 22.3 |
| InPlay Oil | 1.02 | 1.26 | 23.5 |
| Pieridae | 1.48 | 1.83 | 23.6 |
| Tamarack Valley | 2.88 | 3.64 | 26.4 |
| MEG Energy | 15.7 | * | * |
| Paramount | * | * | * |
| Bonterra | * | * | * |
| Imperial | * | * | * |
| Suncor | * | * | * |
| MEDIAN | 3.18** | 3.28 | 3.1 |
*Data unavailable
** Transportation costs are unavailable for MEG Energy in Q4 2022. As such, we have not included their Q3 2022 measure in the median calculation.
KIWETINOHK TRANSPORTATION COSTS
3. Royalties
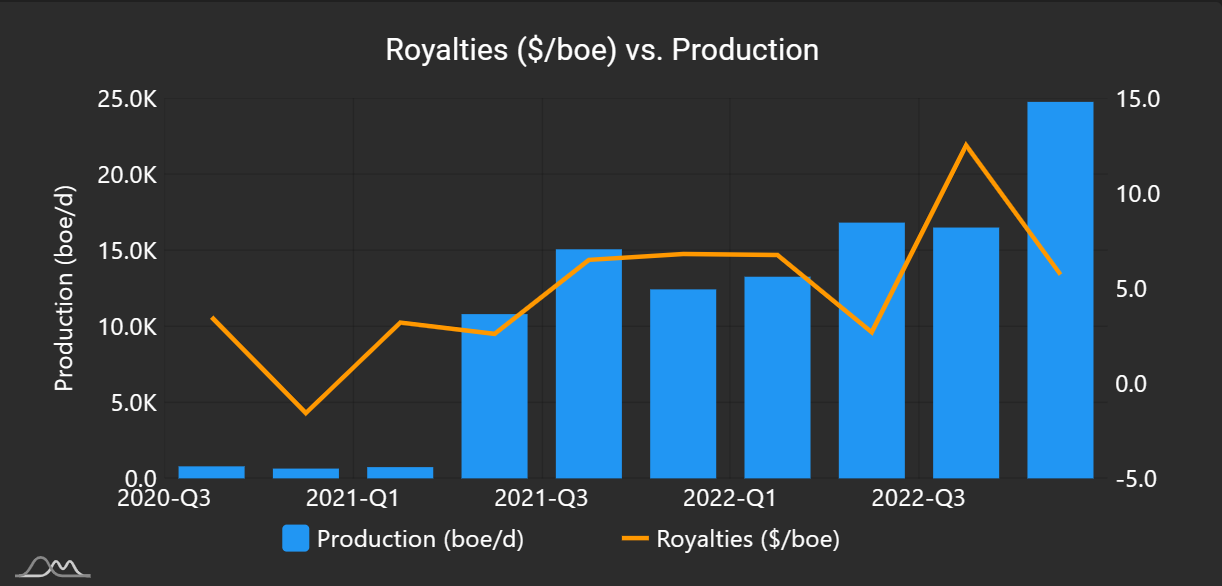
Royalty costs shrunk markedly in Q4, with the median decreasing by 22.9% compared to Q3. Royalties are calculated on a sliding scale with commodity prices, meaning that falling commodity prices in the quarter resulted in lower per barrel royalties paid. Kiwetinohk, appearing once again in the top spot, saw royalties decrease by 54.3% compared to Q3. The company benefitted from Alberta’s drilling and completion cost allowance program (C*), which provides a 5% royalty rate on a well’s initial production until cumulative revenues reach a specified cap. Other strong proportional performers include Pieridae (- 41.1%) and Athabasca (- 39.5%). Pieridae’s royalties decreased on account of reduced production and favourable adjustments to their gas cost allowance. Athabasca’s thermal oil assets are tied via a sliding scale to WCS rates that were slightly depressed in Q4 2022.
| Company | Q3 Royalties ($/BOE) | Q4 Royalties ($/BOE) | % Change |
|---|---|---|---|
| Kiwetinohk | 12.51 | 5.72 | -54.3 |
| Pieridae | 6.33 | 3.73 | -41.1 |
| Athabasca | 10.88 | 6.58 | -39.5 |
| Headwater | 21.93 | 13.51 | -38.4 |
| Petrus Resources | 11.47 | 7.77 | -32.3 |
| MEG Energy | 7.47 | 5.15 | -31.1 |
| Cenovus | 19.69 | 14.19 | -27.9 |
| Canadian Natural Resources | 12.88 | 9.31 | -27.7 |
| Vermilion | 10.94 | 8.43 | -22.9 |
| Surge Energy | 17.27 | 13.5 | -21.8 |
| Cardinal Energy | 19.52 | 15.43 | -21 |
| Baytex | 19.21 | 15.23 | -20.7 |
| Pine Cliff | 5.50 | 4.42 | -19.6 |
| Birchcliff | 6.04 | 4.86 | -19.5 |
| Lucero | 16.11 | 13.11 | -18.6 |
| Whitecap | 16.29 | 13.34 | -18.1 |
| Bonterra Energy | 15.16 | 12.79 | -15.6 |
| Obsidian Energy | 14.06 | 11.93 | -15.1 |
| Gear Energy | 12.14 | 10.4 | -14.3 |
| Kelt Exploration | 7.04 | 6.15 | -12.6 |
| Crew Energy | 6.86 | 6.09 | -11.2 |
| Advantage Energy | 5.80 | 5.31 | -8.4 |
| Tourmaline | 6.63 | 6.22 | -6.2 |
| Paramount | 9.96 | 9.43 | -5.3 |
| InPlay Oil | 12.14 | 11.72 | -3.5 |
| Journey | 12.90 | 12.77 | -1 |
| Pipestone | 7.75 | 7.74 | -0.1 |
| Peyto | 4.18 | 4.31 | 3.1 |
| Yangarra | 4.93 | 5.22 | 5.9 |
| Tamarack Valley | 14.06 | 15.07 | 7.2 |
| ARC Resources | 9.23 | 10.18 | 10.3 |
| Spartan Delta | 4.89 | 5.53 | 13.1 |
| NuVista | 6.23 | 7.94 | 27.4 |
| Crescent Point | 12.33 | * | * |
| Ovintiv | * | * | * |
| Imperial | * | * | * |
| Suncor | * | * | * |
| MEDIAN | 10.90** | 8.43 | -22.9 |
* Data unavailable
** Royalty costs are unavailable for Crescent Point in Q4 2022. As such, we have not included their Q3 2022 measure in the median calculation.
KIWETINOHK ROYALTIES
4. Operating Netbacks (After Hedging)
On a per BOE basis, netbacks remained largely unchanged and held up remarkably well given the reduction in oil prices in the quarter. Mixed Sweet Blend Edmonton fell from an average of around 115 C$/bbl in Q3 2022 to 108 C$/bbl in Q4 2022. A reduction in hedging losses blunted the effect of falling commodity prices, and as a result, the median netback grew by 0.1% in Q4. Pieridae Energy saw the most significant positive netback growth in Q4, with the company’s netback growing by 133.8% compared to Q3. This was driven by reduced royalty expenses and reduced operating costs for the quarter. Other strong performers include Petrus Resources (71.1%) and Kelt Exploration (33.0%). Petrus ramped up production significantly in this quarter, taking advantage of favourable, demand-driven natural gas price movements. Kelt Exploration, for which natural gas accounted for 65% of their record-setting Q4 production, also referenced favourable natural gas prices in discussing their netback growth. The company also benefitted from some savvy commodity hedges placed earlier in the year.
| Company | Q3 Netback ($/BOE) | Q4 Netback ($/BOE) | % Change |
|---|---|---|---|
| Pieridae Energy | 9.07 | 21.21 | 133.8 |
| Petrus Resources | 24.98 | 42.73 | 71.1 |
| Kelt Exploration | 28.19 | 37.49 | 33 |
| Tourmaline | 23.68 | 30.56 | 29.1 |
| Kiwetinohk | 35.9 | 46.07 | 28.3 |
| Peyto | 20.64 | 26.34 | 27.6 |
| Advantage Energy | 21.11 | 26.37 | 24.9 |
| Bonterra Energy | 36.01 | 42.99 | 19.4 |
| Pine Cliff | 18.66 | 21.06 | 12.9 |
| Pipestone | 31.88 | 34.58 | 8.5 |
| Spartan Delta | 32.74 | 34.28 | 4.7 |
| Crew Energy | 26.43 | 26.92 | 1.9 |
| Paramount | 38.1 | 38.64 | 1.4 |
| Ovintiv | 29.55 | 29.13 | -1.4 |
| NuVista | 41.11 | 40.36 | -1.8 |
| InPlay Oil | 39.28 | 38.42 | -2.2 |
| Journey | 27.24 | 26.58 | -2.4 |
| ARC Resources | 34.45 | 32.79 | -4.8 |
| Whitecap | 44.58 | 42.26 | -5.2 |
| Yangarra | 45.44 | 42.74 | -5.9 |
| Crescent Point | 49.46 | 46.44 | -6.1 |
| Obsidian Energy | 44.18 | 41.21 | -6.7 |
| Baytex | 42.43 | 38.58 | -9.1 |
| Headwater | 56.54 | 50.89 | -10 |
| Vermilion | 78.42 | 70 | -10.7 |
| Lucero | 44.93 | 40.07 | -10.8 |
| Surge Energy | 46.27 | 40.97 | -11.5 |
| Cardinal Energy | 42.72 | 37.09 | -13.2 |
| Enerplus | 38.49 | 33.2 | -13.7 |
| Gear Energy | 46.19 | 38.21 | -17.3 |
| Birchcliff | 38.64 | 31.92 | -17.4 |
| Tamarack Valley | 51.9 | 42.24 | -18.6 |
| MEG Energy | 62.63 | 43.89 | -29.9 |
| Athabasca | 30.76 | 20.47 | -33.5 |
| Canadian Natural Resources | * | * | * |
| Cenovus | * | * | * |
| Imperial | * | * | * |
| Suncor | * | * | * |
| MEDIAN | 38.30 | 38.31 | 0.1 |
* Data unavailable
PIERIDAE OPERATING NETBACK (after hedging)

With Q4 2022 largely in the rearview mirror, companies have shifted their focus to the year ahead. In their year-end releases, some companies have expressed an intention to trim back their capital programs and lower production guidance estimates. With commodity markets under pressure since year end, in part spooked by macroeconomic turmoil and flagging financial institutions, it would be unsurprising to see cautious approaches become more commonplace. We’ll be keeping a keen eye on corporate announcements and any capital budgets changes from Canadian producers to see how they’ll navigate the coming months.
For more data and analytical tools, check out BOE Intel.
Note: As many of the metrics above are non-GAAP measures, we have made attempts to standardize metrics across companies.