
April 2023 Alberta Expiring Land Report
Each week, XI Technologies uncovers trends and insights using our enhanced data and software focused on the WCSB. If you’d like Word to the Wise delivered directly to your inbox, subscribe here
XI Technologies looks at expiring land to provide useful business development intel for service companies and exploration and production (E&P) companies alike.
For service companies, expiring lands provide insight into where drilling activity is most likely to occur in the coming months, and with which companies. For E&Ps, the expiring land report helps flag farm-in opportunities and/or land that may come available in their core area(s).
According to AssetBook data, the following are the top 25 companies with expiring lands in Alberta over the next 12 months.

Figure 1 – Expiring Hectares (Top 25 Companies)
When looking at the top 25 companies based on expiring hectares (ha), it is also useful to look at the land numbers in context to the overall total of expiring land. These 25 companies represent 69% of the total 3,172,796 ha expiring in Alberta in the next 12 months. An additional 256 companies represent the remaining 31% of expiring land.
25 of 281 companies represent 69% of land expiring in the next 12 months.
It makes sense, as these are generally also the largest operators in Alberta. With a total of just over 30 million ha of crown land in Alberta, the expiring lands represent 11% of the total.
11% of the total land in Alberta is expiring in the next 12 months.
In addition to knowing the top 25 companies with lands nearing expiry, it may be useful to know the bonus amounts paid on those lands. AssetBook’s identification and ranking of expiring lands based on the size of bonuses paid helps prioritize companies with the most money on the line and, therefore, highlights companies that may be more open to farm-in or partnership opportunities.
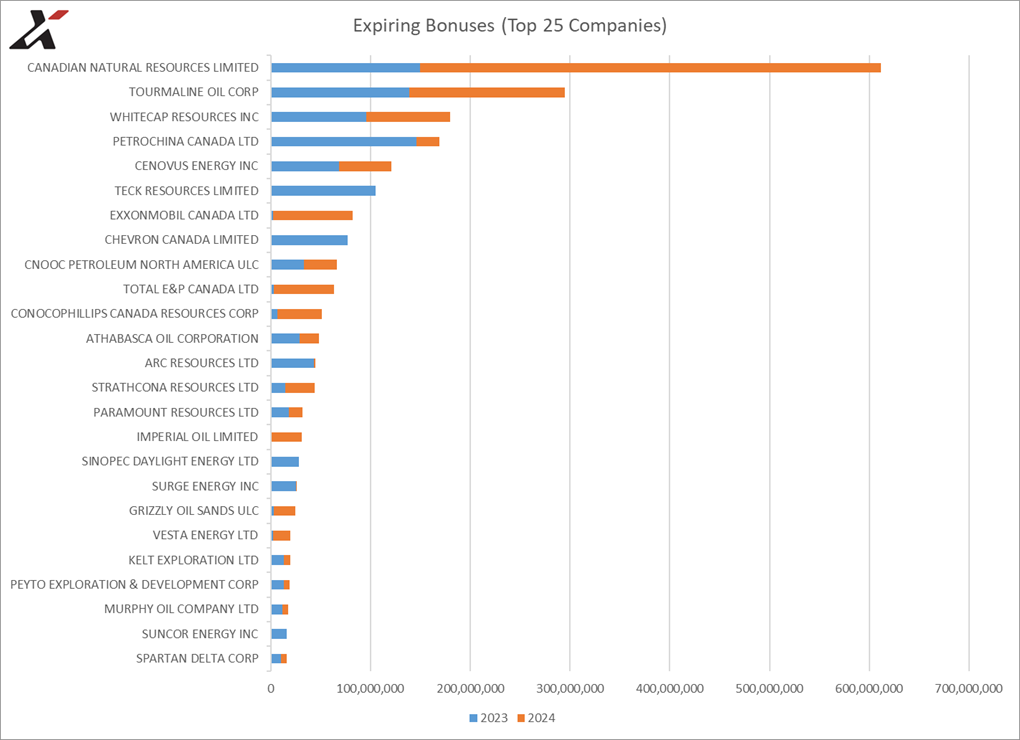
Figure 2 – Expiring Bonuses (Top 25 Companies)
Expiring bonuses total over $2.5 billion over the next 12 months. The top 25 companies represent 71% of that total, with the single largest producer’s expiry profile over $600 million.
As with the total land, the top 25 companies, or 9% of the total companies, represent 71% of the total expiring bonuses.
In our last Word to The Wise, we explored the expiring lands and bonuses relative to the total holdings of the 25 companies and compared the $/ha of their upcoming expiries.
This month, we look at the existing land, total bonuses, and $/ha from a regional perspective. Looking at the land on a provincial map, we can see obvious clusters around the Fort McMurray and Grande Prairie regions.
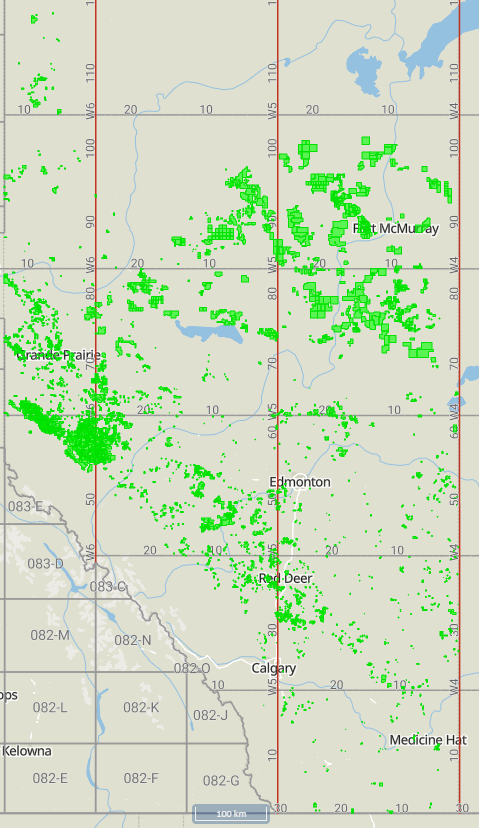
Figure 3 – Land on Provincial Map
Breaking it down by region, we can see that most expiring land, a combined 80%, comes from Fort McMurray, Grande Prairie, and Peace River.
 Figure 4 – Expiring Land by Region
Fort McMurray and Grande Prairie represent 62% of the expiring land in the province.
Similarly, the expiring bonuses reflect the same trend, with Fort McMurray and Grande Prairie accounting for 82% of the value. While Peace River represents 17% of the expiring land, it only represents 7% of the value.
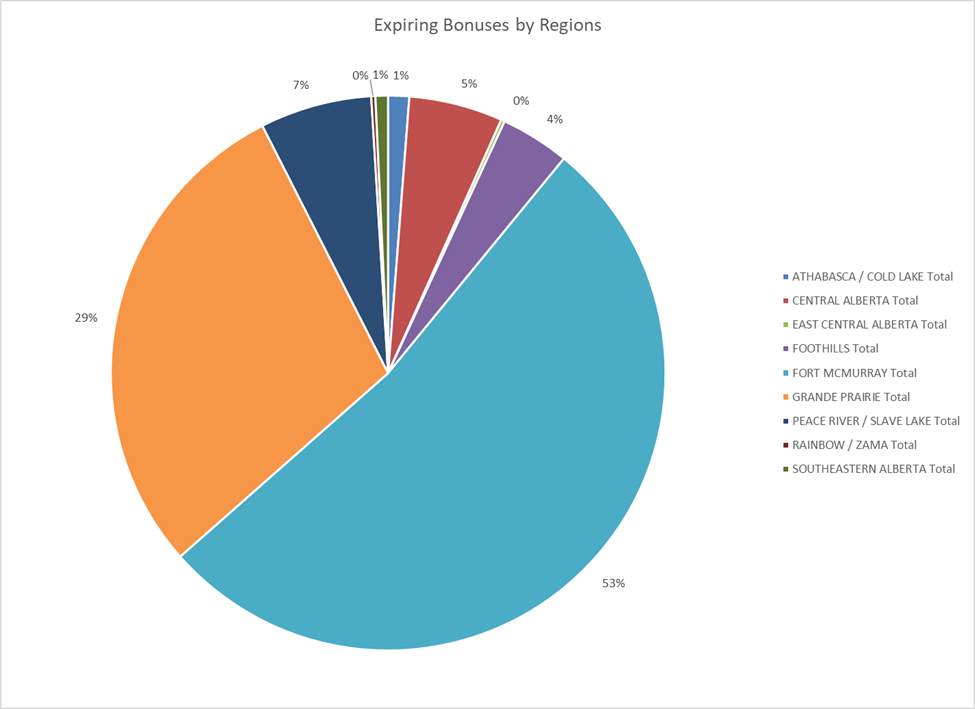
Figure 5 – Expiring Bonuses by Region
Fort McMurray and Grande Prairie represent 82% of the expiring bonus value in the province.
Looking at these values together, we can see the average $/ha by region.

Figure 6 – Dollars per Hectare Bonus by Region
The highest average bonus for expiring land is in the Foothills and Fort McMurray regions, each with approximately $1140/ha, with Grande Prairie ~$900/ha. Southeastern Alberta and East Central Alberta have the lowest value expiring bonuses in the province, suggesting most land is continued because it is largely developed, or not in high demand.
The highest expiring average $/ha bonuses are in Foothills and Fort McMurray.
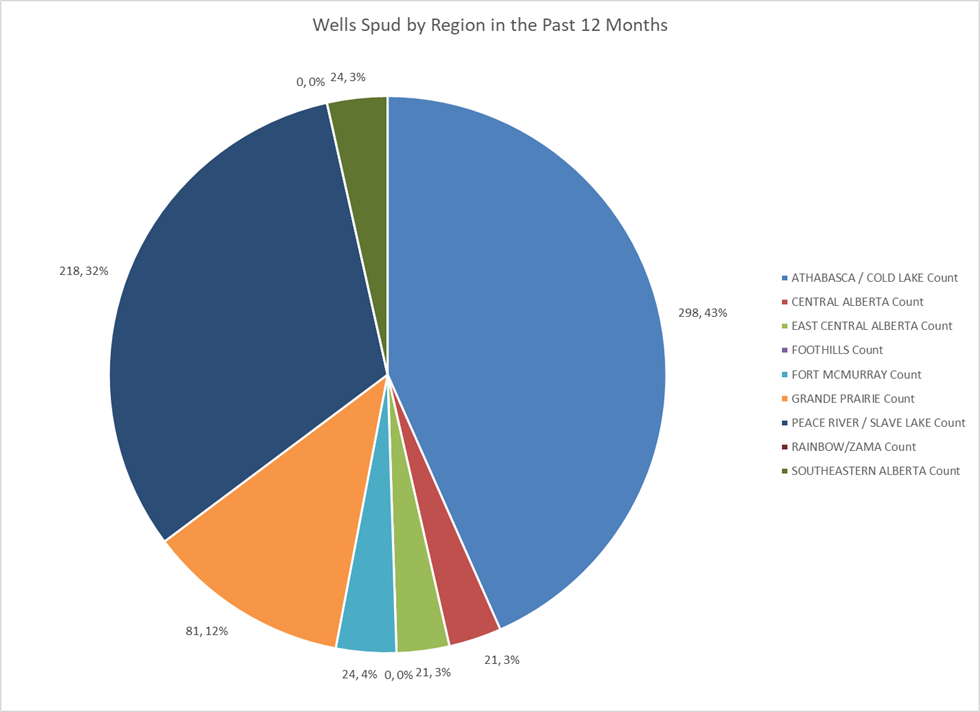
Figure 7 – Wells Spud by Region in the Past 12 Months
By filtering to SPUD data for the past 12 months, we can see that within these regions, drilling activity has been the highest in an area with a relatively low overall average expiring bonus, but also only 4% of the expiring land and 1% of the overall total expiring bonus. The Foothills, with only 3% of expiring land and 4% of expiring bonuses, has the highest value acreage across all regions, yet little to no drilling activity.
Peace River, with the second highest SPUD number, also has a relatively low average bonus per ha, but 17% of the expiring land and 7% of the total expiring bonus.
Fort McMurray, with both high expiring acreage and total bonuses and one of the highest $/ha averages, accounts for only 4% of the total drilling activity.
Athabasca, which accounts for the highest number of wells spud in the past 12 months, has a relatively low expiring $/ha value, yet accounts for only 4% of expiring land and 1% of the total expiring bonus.
The most drilling activity in the past 12 months has been in the Athabasca/Cold Lake Region, which represents only 4% of the upcoming expiring land, and 1% of the total expiring bonus.
If you were looking for an opportunity, which of these areas would you investigate ?
Click here to download the April Expiring Lands Report
Want to know more about A&D Scoping with AssetBook? Watch the video
Thank you for joining XI on our weekly journey of data exploration and discovery. We hope you found this article to be informative and thought-provoking.
If you’d like to learn more about how XI’s AssetSuite software can analyze companies, packages, or regions throughout Western Canada, visit our website or contact XI Technologies.