
Each week, XI Technologies uncovers trends and insights using our enhanced data and software focused on the WCSB. If you’d like Word to the Wise delivered directly to your inbox, subscribe here.
Today’s article is the first of a 2-part series where we take a closer look at drilling activity over the past year.
This week, we’ll be looking at the 25 most-active operators drilling wells across the WCSB.
- Who are they, and how many wells are we talking about? How deep are they going?
- Where are they drilling?
- What are they drilling for?
The 25 Most Active Operators in the Last 12 Months
How Many Wells Did They Drill?

Figure 1 – Wells Drilled
What This Tells Us:
A breakdown of the 25 companies who’ve drilled the most wells in the past 12 months.
- Left: A visual comparison of those 25 companies and the wells they’ve drilled.
- Right: The drilling history of each showing their activity year-over-year, to help spot any significant trend shifts in their drilling activity over time.
If You’re Using the Interactive Version:
Click an operator to highlight their drilling numbers and show their wells on the map.
What We’re Learning:
When it comes to drilling wells, some companies have been leading the way with their impressive numbers. In the past year, it’s clear that Cenovus Energy (“Cenovus”) has taken the top spot, showing their commitment to expanding their drilling operations by drilling a whopping 598 wells. Not far behind is Canadian Natural Resources Limited (“CNRL”), who takes the second position with 413 wells drilled. Another notable performer is Teine Energy Ltd. (“Teine”), securing the third spot with 283 wells drilled.
How Many Meters Did They Drill?
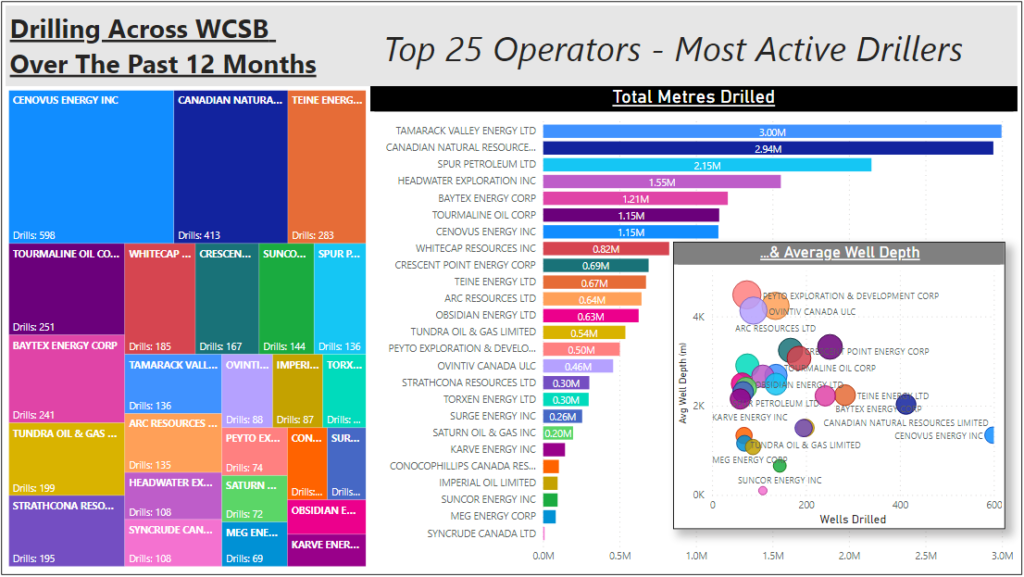
Figure 2 – Total Meters Drilled
In terms of drilling ‘spend’, the number of wells drilled is only one part of the story. The depth & complexity of a well is the true driver of drilling cost, so let’s have a look.
What This Tells Us:
- Left: The same breakdown (as previous) of the top 25 companies for wells drilled.
- Right: Those same companies, but sorted by total number of meters of those wells drilled in the last year.
If You’re Using the Interactive Version:
Find a company’s average well depth by either:
- clicking an operator or
- hovering over their corresponding color on the scatterplot to view a quick summary
What We’re Learning:
From this angle, we see a very different story playing out. With 598 wells drilled, Cenovus Energy Inc (“Cenovus”) may have outdrilled the 2nd ranked operator by 45% (CNRL, with 413 wells), CNRL drilled over 150% more total meters!
Focusing solely on Total Meters Drilled, Tamarack Valley Energy Ltd. (“Tamarack”) has claimed the leading position, having drilled an impressive 3 million meters in the past 12 months.
And yet, the plot thickens further when well depth becomes a factor; 3 operators rise above the pack when we look at average well depth. Peyto Exploration and Dev. (“Peyto”), ARC Resources Ltd. (“ARC”) and Ovintiv Canada ULC (“Ovintiv”) may not have topped the charts for total wells or meters drilled, but they distinguish themselves with their average well depths of 4,485m, 4,237m, and 4,132m respectively.
Where Are They Drilling?
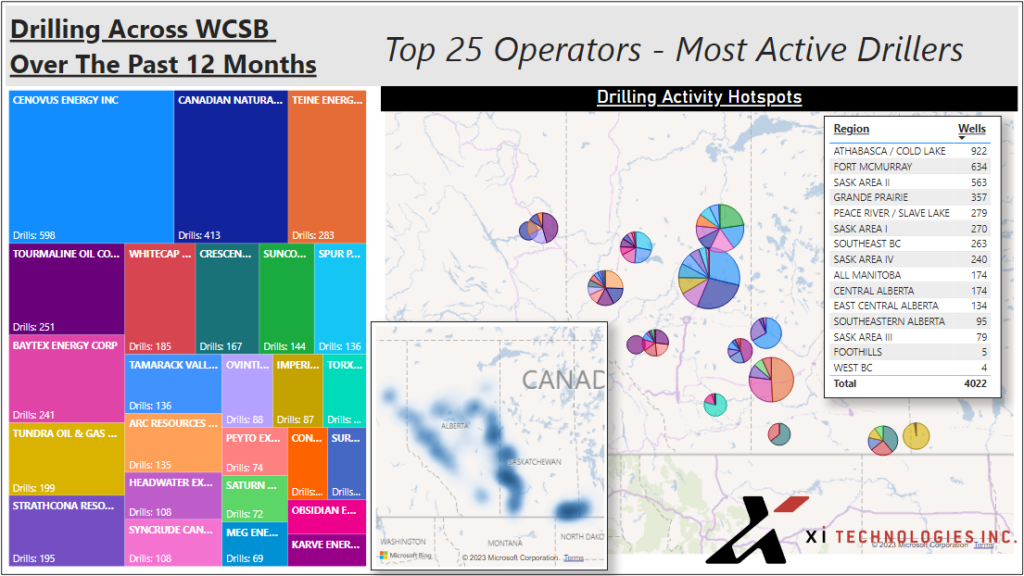
Figure 3 – Drilling Activity Hotspots
The heavy-hitters in our industry are vastly diverse in terms of asset portfolios, growth objectives, and areas of focus. This couldn’t be more apparent, as when we observe this particular visual.
What This Tells Us:
- The primary ‘hotspots’ where drilling activity was most prevalent.
- For a more detailed breakdown of the “who’s” and “where’s”, a provincial/regional* breakdown of where our top 25 operators drilled.
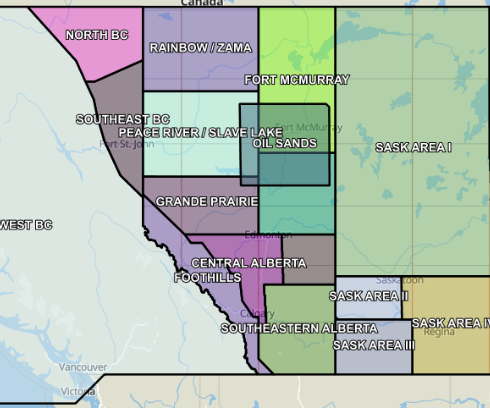
* WCSB Regions – Wells throughout WCSB are assigned to one of 19 regions across 4 provinces. For reference, here’s a sample map showing all WCSB regions.
If You’re Using the Interactive Version:
- Select an operator (left) to see where their drilling is most concentrated, and the distribution of wells across various regions.
- To display more than 1 operator at a time, hold ‘Ctrl’ as you click.
- Compare the well counts of specific operators in a given region by hovering over the pie-graph sections on the map.
What We’re Learning:
Not surprisingly, Alberta’s heavy oil regions dominate WCSB drilling activity with nearly 40% of wells drilled. As we look across to the western side of Alberta, the Peace River & Grande Prairie regions make up nearly 16%.
Saskatchewan drilling remains a core focus for several companies, as this makes up 28% of WCSB wells drilled last year.
Click here to view and interact with all of this data on our interactive dashboard.
Eliminate inefficiencies and minimize the cost associated with tour research and get nearly 180,000 digitized well records accessible at the click of a button using XI’s OffsetAnalyst
To learn more, contact XI Technologies.