The first two Canadian E&P companies reported Q3 production and financials in the last 24 hours: Whitecap Resources and Tamarack Valley. Here are some noteworthy charts from BOE Intel with data from those quarters:
Click here to visit our BOE Intel Plans page and gain access for yourself and your company.
Whitecap Resources
Whitecap Resources Inc. announces third quarter results and 2024 budget

- Figure 1 – Capital expenditures vs. Net Debt
- Whitecap quarterly capex was $282 MM which is the highest to date for the company as it anticipates being in the upper end of its 2023 full year capex range of $900-$950 MM. 2024 capex guidance was issued in the $1-$1.2 billion range. More than half (~$600 MM) of that capex will target Whitecap’s “West” division where the Montney and Duvernay acreage are situated. Whitecap sees these two plays as its growth engine, with production from the West division guided to grow from current levels ~70,000 BOE/d to 110,000 BOE/d by the end of 2027. Meanwhile net debt continues to track lower, with net debt at the end of Q3 of $1.26 billion.
Figure 1

- Figure 2 – Operating Costs
- Operating costs fell to $13.97/BOE in the quarter, down from $15.16/BOE in Q2. This matched the lowest quarterly operating costs for Whitecap since Q1 2022. While the company remains predominantly liquids weighted, its natural gas weighting has increased since the XTO acquisition. Given that, one might expect that operating costs per BOE could begin to fall although no formal operating cost guidance has been given at this point.
Figure 2
- Figure 3 – Operating netback (after hedging)
- Whitecap’s operating netback improved by 14% in Q3 2023 compared to Q2 2023 as a result of improved realized pricing.
Figure 3

Tamarack Valley
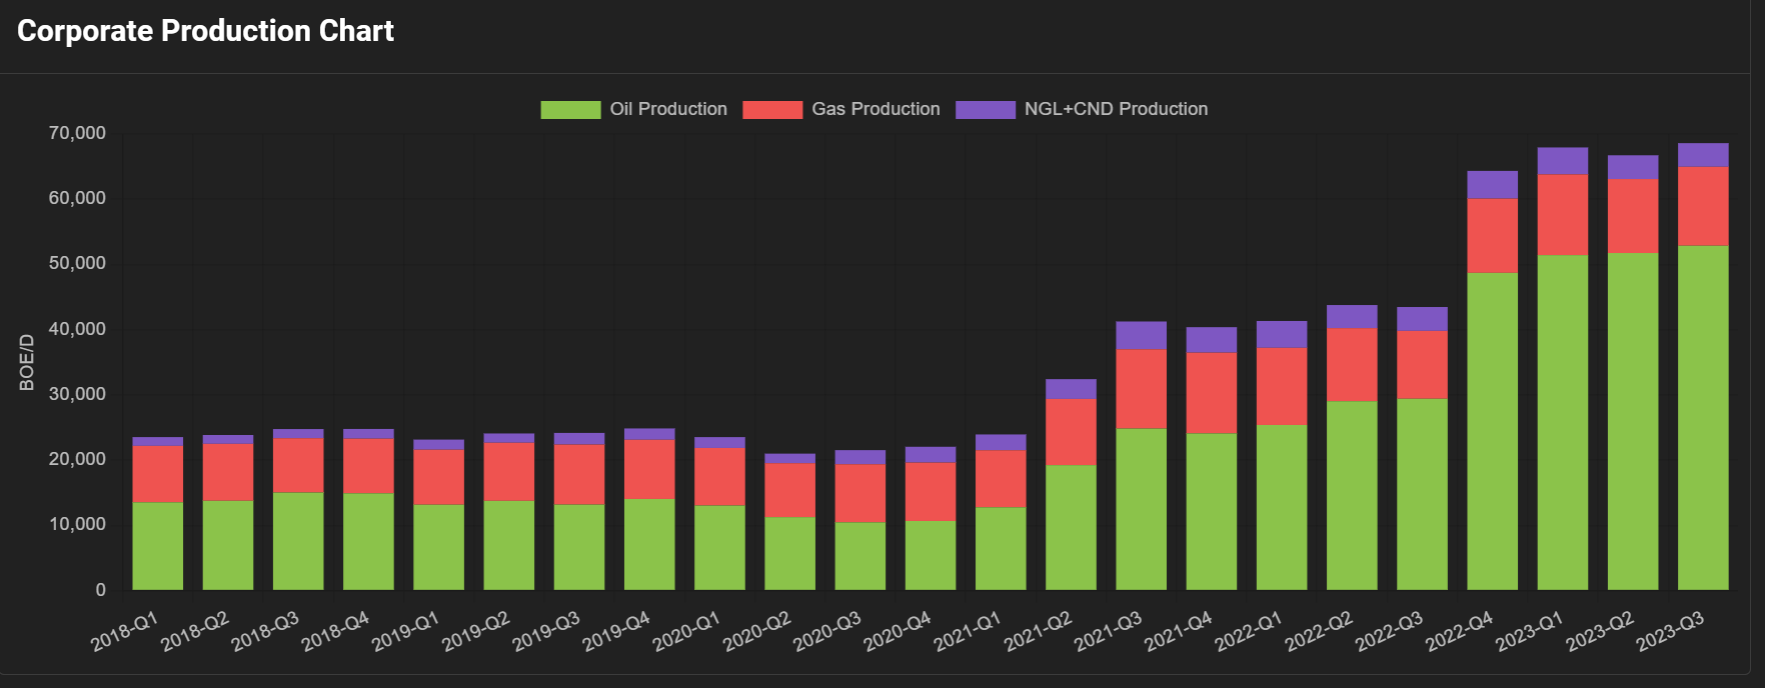
Figure 1 – Net debt vs. Corporate Production
- Q3 was a record production quarter for Tamarack Valley. This, combined with improved realized prices, non-core asset sales and assets held for sale at quarter-end meant that net debt showed significant improvement, down to $1.128 billion from Q2 levels of $1.374 billion. Note that prior increases in net debt from 2020-2022 were largely centered around acquisitions as the company added to its now dominant Charlie Lake and Clearwater positions during those years. The production impact from those acquisitions is also shown in Figure 1.
Figure 1

Figure 2 – Operating Costs
- Operating costs fell to $8.73/BOE in Q3, a large improvement from the prior quarter figure of $10.09/BOE. The company cites the impact of its Wembley gas plant in the Charlie Lake oil region, as well as additional Clearwater infrastructure and higher production as reasons for the improvement. In fact, this is the lowest quarterly data point for operating costs since the company began to report it separately in 2020.
Figure 2

Figure 3 – Operating netback (after hedging)
- Lower operating costs, incremental infrastructure additions and higher realized prices drove a big jump in operating netback in Q3. Quarterly operating netback increased to $51.72/BOE from $36.68/BOE in Q2 2023.
Figure 3
