• Sign up for the Daily Digest E-mail
  • Facebook
  • X
  • LinkedIn

BOE Report

Sign up
  • Home
  • StackDX Intel
  • Headlines
    • Latest Headlines
    • Featured Companies
    • Columns
    • Discussions
  • Well Activity
    • Well Licences
    • Well Activity Map
  • Property Listings
  • Land Sales
  • M&A Activity
    • M&A Database
    • AER Transfers
  • Markets
  • Rig Counts/Data
    • CAOEC Rig Count
    • Baker Hughes Rig Count
    • USA Rig Count
    • Data
      • Canada Oil Market Data
      • Canada NG Market Data
      • USA Market Data
      • Data Downloads
  • Jobs

SLB to sell Palliser assets – see the assets and production involved in its partnership with Torxen Energy – BOE Intel

November 5, 20247:00 AM Dan Rutherford

SLB announced two weeks ago that it has reached a definitive agreement to sell its interests in the Palliser Block in Alberta. The assets consist of oil and gas wells, surface facilities, a pipeline network and certain oil and gas development rights.

No official price was mentioned for the transaction, and the buyer was not named.

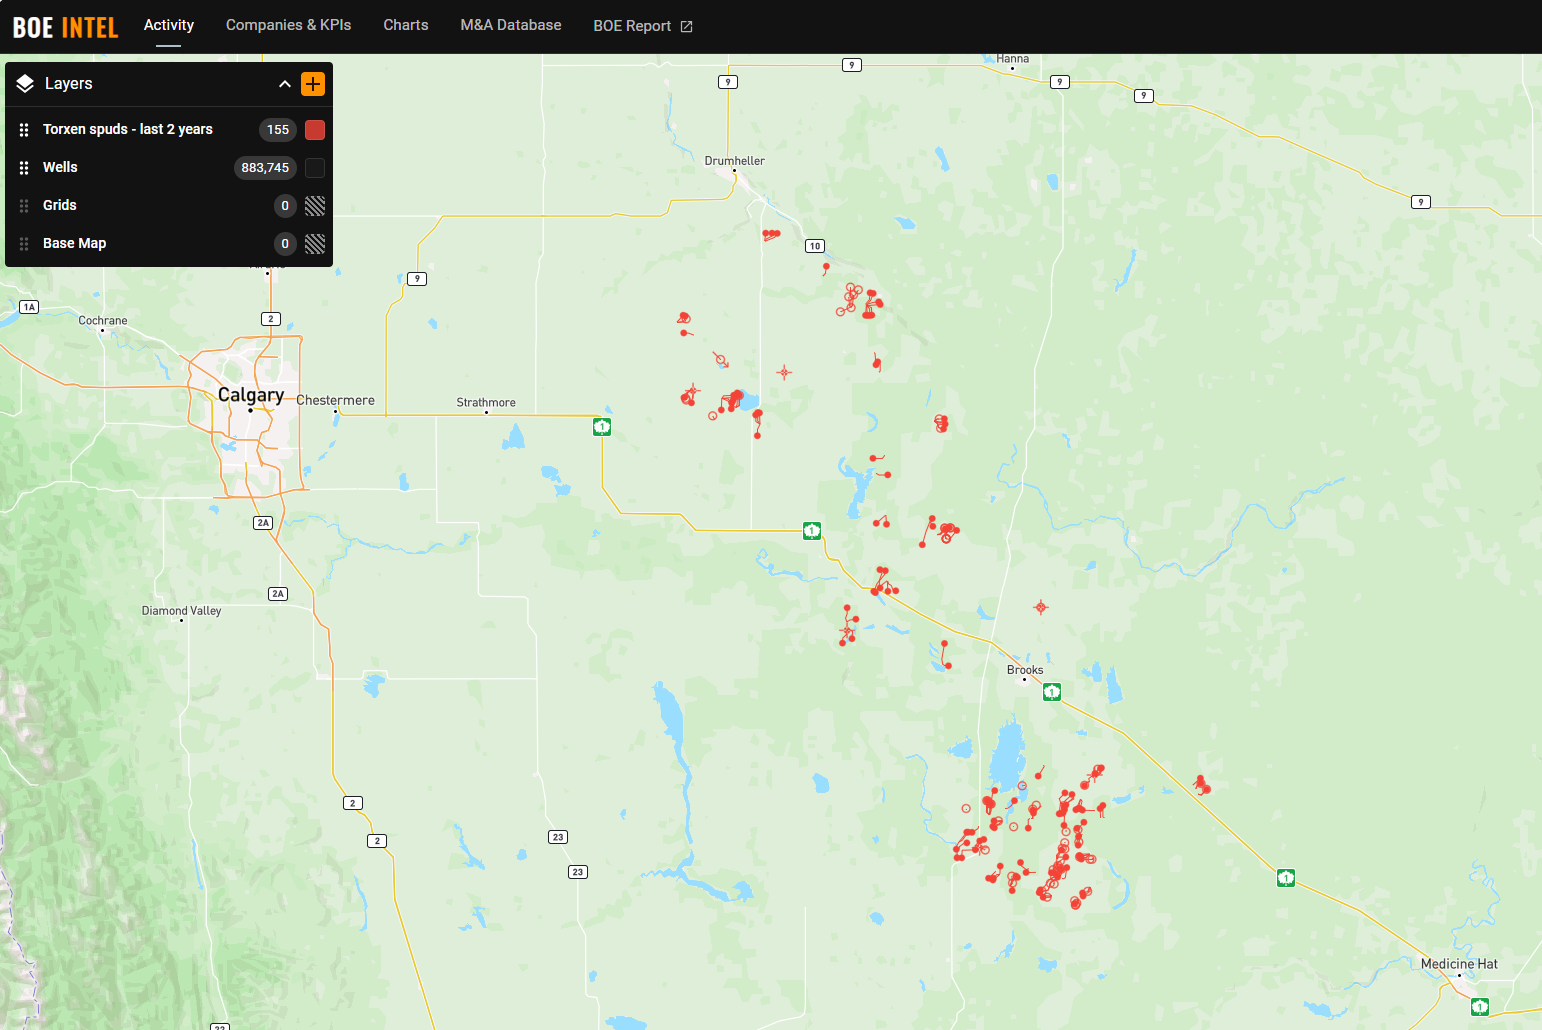
These assets were jointly purchased with Torxen Energy in 2017 from Cenovus. SLB was the majority non-operating owner, while Torxen has been the operator. The map above shows spud activity for Torxen over the last 2 years.

The total gross production from these assets (licensed to Torxen as the operator) was ~58 MBOE/d in August 2024.

Keep in mind for the entirety of the public data presented herein that while the public data shows licences/production, etc. as belonging to Torxen, the exact nature of the working interest share of those wells and production depends on the agreement between Torxen and SLB, and SLB was the majority owner.

Figure 1 – Torxen total gross licensed production

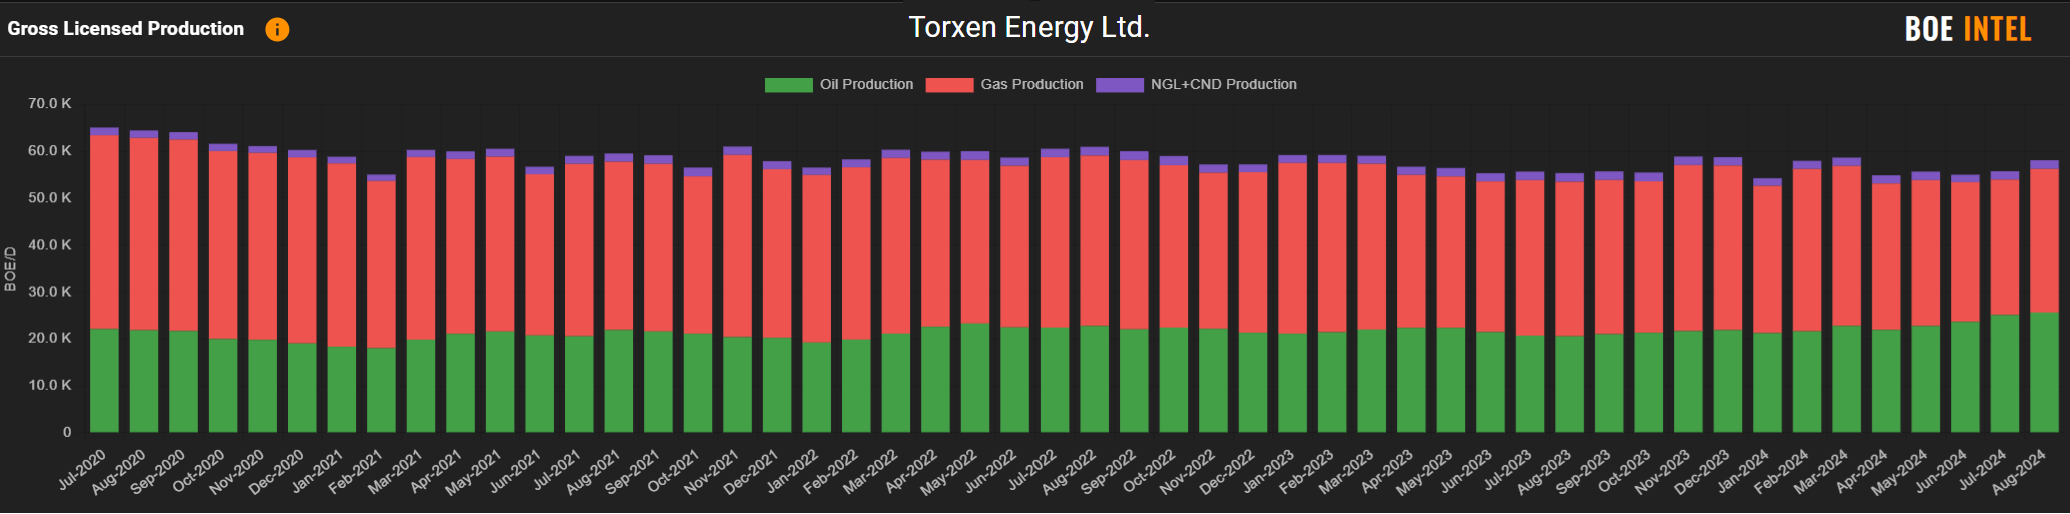
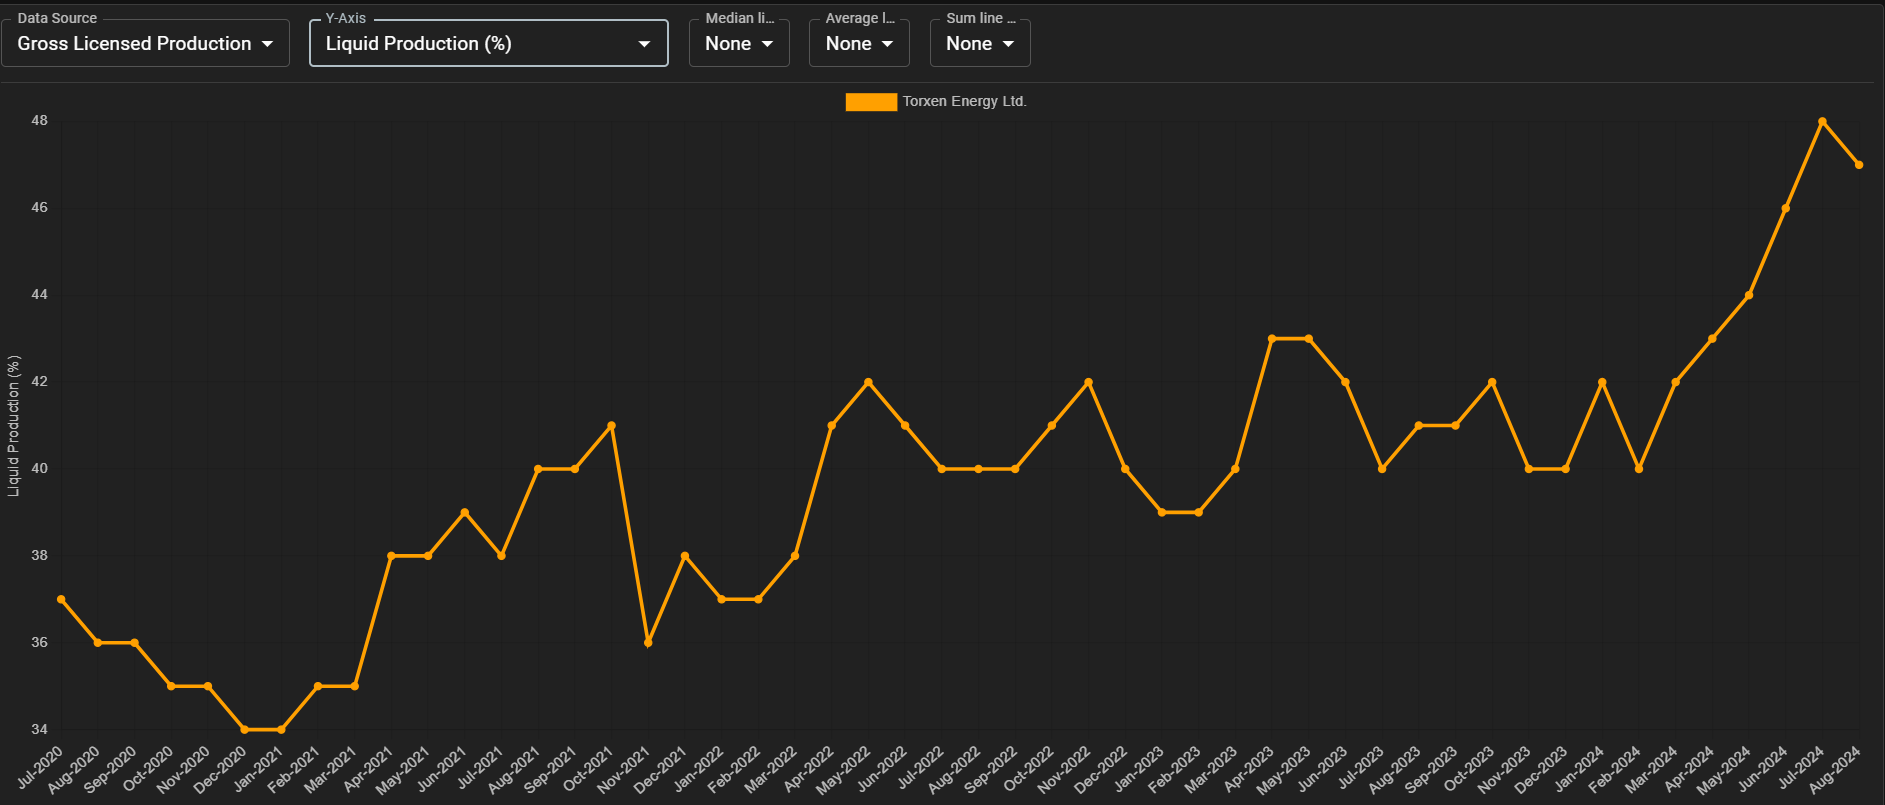
While total production had been mostly flat since 2020, there has been a recent uptick in oil and liquids production over the last year and a half, with gross oil production exceeding 25,000 b/d in recent months. Liquids percentage hit 47% in August 2024, up substantially from the mid-30% level in 2020.

Figure 2 – Torxen gross licensed oil production 

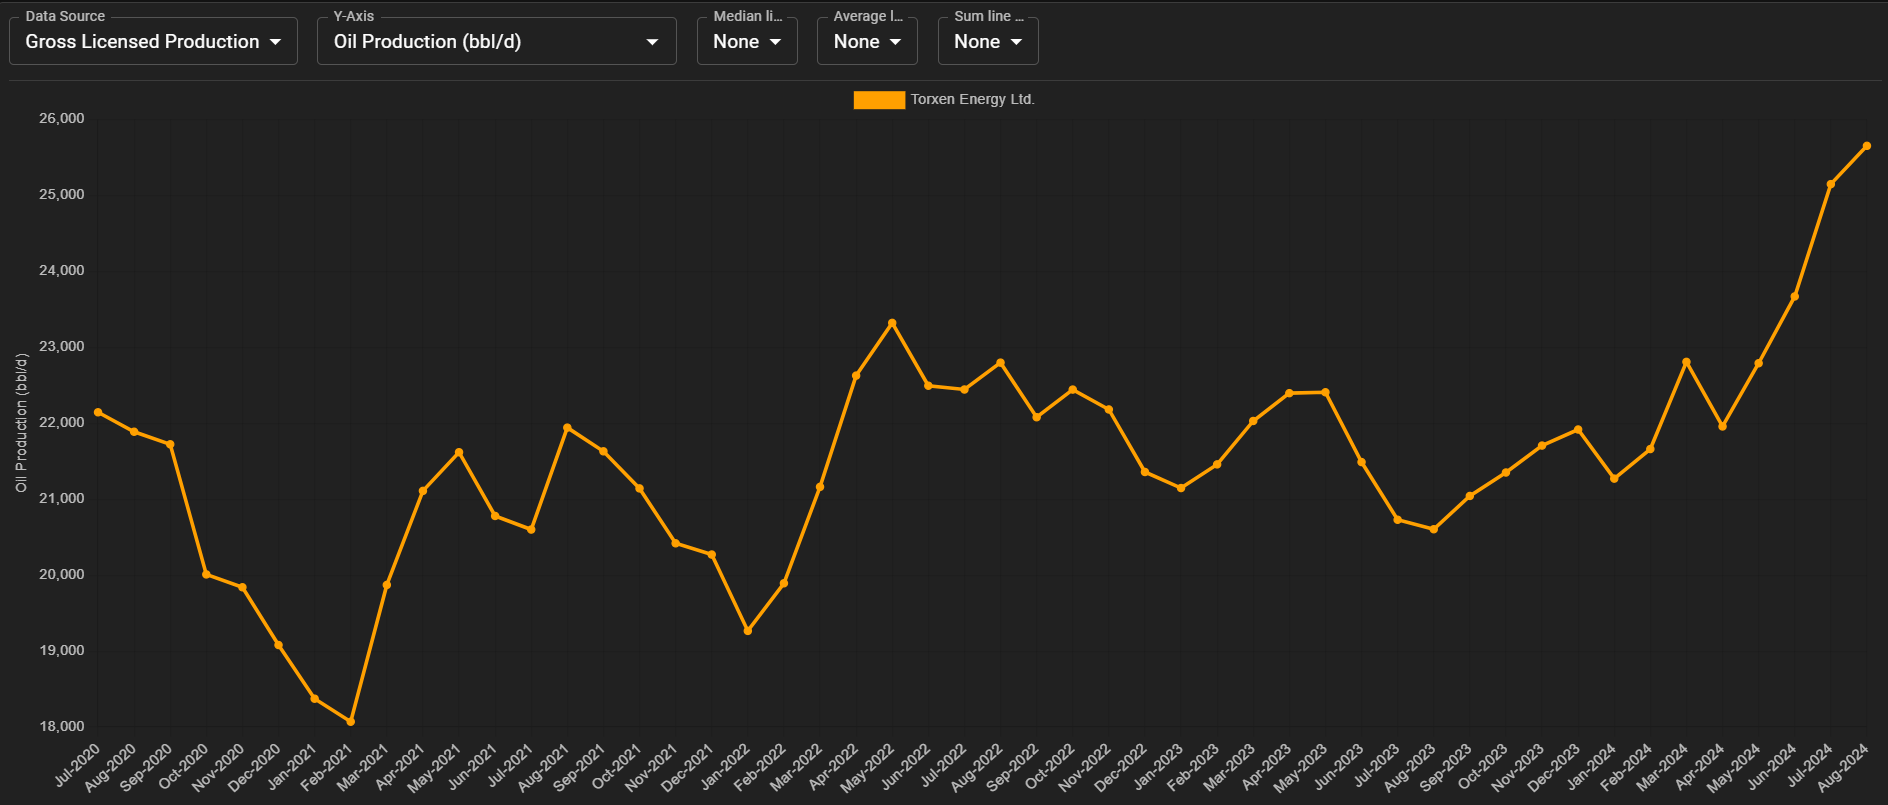
Figure 3 – Torxen Liquids Percentage

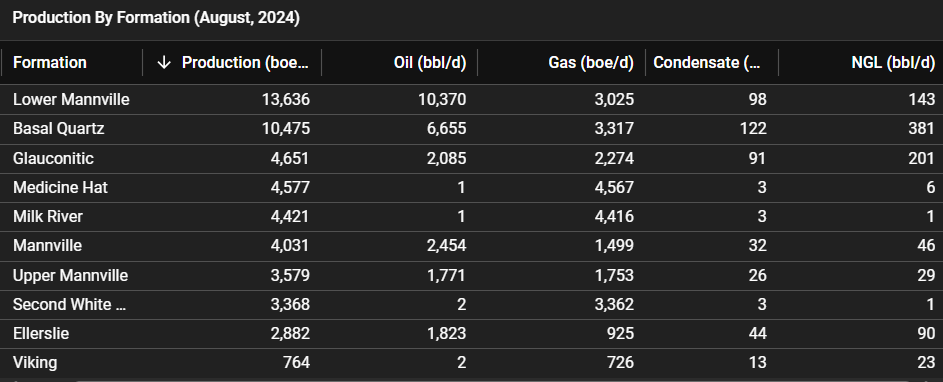
The Basal Quartz and the Mannville were the most targeted formations for spud activity over the last 2 years (Figure 4), so not surprisingly those formations are represented heavily in the company’s breakdown of production by formation (Figure 5).

Figure 4 – Torxen Spud activity by formation – last 2 years

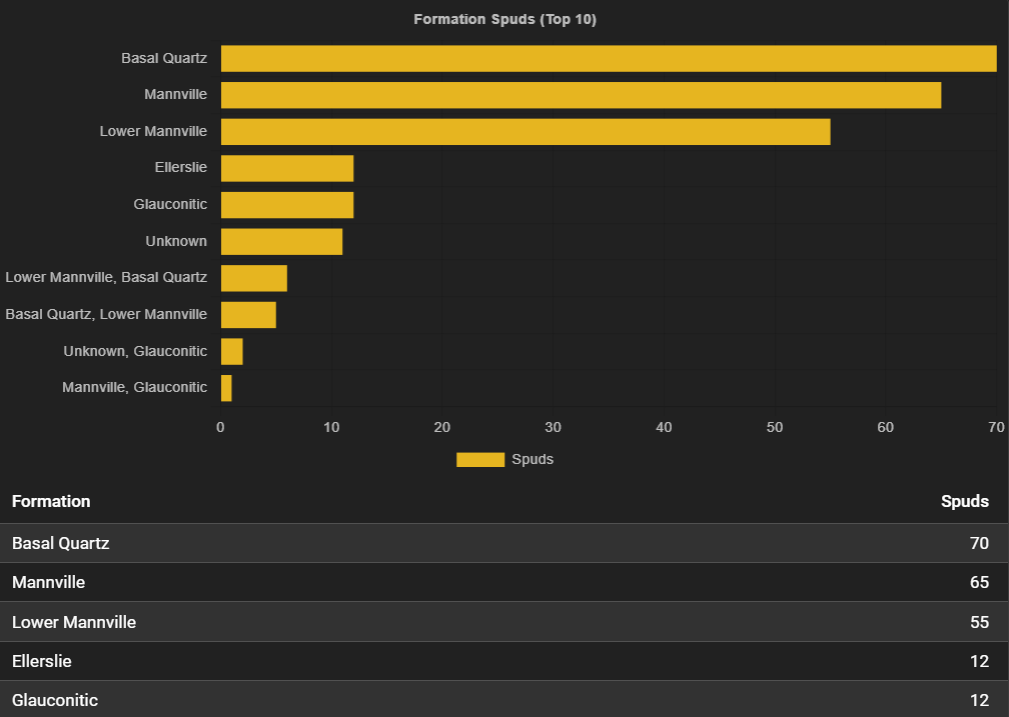
Figure 5 – Torxen gross licensed production by formation


Cenovus StackDX Intel Torxen Energy

Follow BOE Report
  • Facebook
  • X
  • LinkedIn

Sign up for the BOE Report Daily Digest E-mail

Successfully subscribed

Latest Headlines
  • ConocoPhillips Makes Application to Cease to Be a Reporting Issuer in Canada
  • Chevron wins Exxon case but loses time, oil and billions
  • US natgas prices edge up to 3-week high as heat boosts air conditioning use
  • US drillers add oil/gas rigs for first time in 12 weeks, Baker Hughes says
  • Saturn Oil & Gas Inc. Announces Release Date for Q2 2025 Results and Provides Conference Call / Webcast Details

Return to Home
Alberta GasMonthly Avg.
CAD/GJ
Market Data by TradingView

    Report Error


    Note: The page you are currently on will be sent with your report. If this report is about a different page, please specify.

    About
    • About BOEReport.com
    • In the News
    • Terms of Use
    • Privacy Policy
    • Editorial Policy
    Resources
    • Widgets
    • Notifications
    • Daily Digest E-mail
    Get In Touch
    • Advertise
    • Post a Job
    • Contact
    • Report Error
    BOE Network
    © 2025 Stack Technologies Ltd.