On September 30, 2018, Husky announced a proposal to acquire MEG Energy for $6.4 billion. At the time, the proposal was for $11/share (part cash, part Husky stock), and represented a rather sizeable 37 percent premium to MEG’s prior day closing price of $8.03. It was a hostile bid, and was ultimately defeated by MEG shareholders. Looking back on it, it appears as though shareholders chose wisely, as MEG’s equity closed today at $23.29/share, more than double that $11/share bid. However, the fascinating part of it is that the company’s enterprise value is more or less the same today (call it a few percent higher) as Husky’s offer value was back in 2018. Back in 2018, the equity component of the offer was only 52% of the offer amount, while today the equity component is ~90% of the enterprise value*, as the company has paid down an enormous amount of debt over the last 6 years.

*we don’t know MEG’s Q4 net debt yet, so just for the purposes of this illustration, we’ve used the same net debt level as Q3/2024 and market cap as of today’s close for the last bar.
So it got us thinking, what has changed with the business since then? We turned to BOE Intel to pull up some charts for a quick visual.
Production
Quarterly production has generally trended higher, outside of turnaround quarters. Of course, the next step change higher will come with the company’s announced Christina Lake expansion, a 25,000 bbl/d addition expected to come online in 2027.

Net debt
Net debt has been the big story, with net debt levels falling almost $3 billion since peaking in Q1 2019.

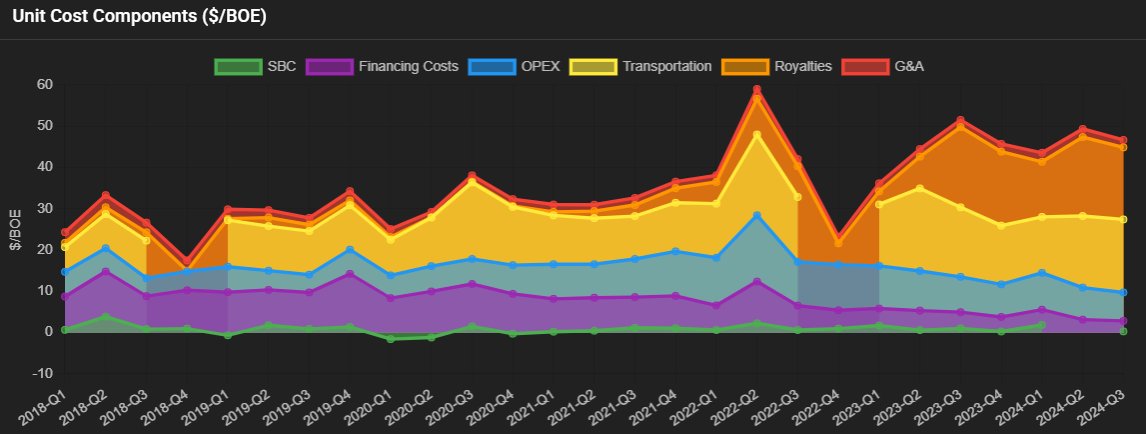
Cost structure
The company’s cost structure shows some interesting trends. The big cost savings has been the finance/interest component as net debt levels have come down. Once over $10/bbl, those costs were down to $2.55/bbl in Q3 2024. On the flip side, transportation costs and royalties have seen increases. On the transportation side, the increased costs generally reflect a strategic attempt to access diverse global markets and enhance realized prices. As for royalties, the company achieved post-payout royalty status in Q2 2023, and the per barrel cost increase is notable but is also the reflection of a successful project.
Operating netback (after hedging)
Thanks in part to increased oil prices, and lower heavy oil differentials (thanks to TMX), MEG’s operating netback is significantly higher than when the Husky offer was announced.

Return of capital to shareholders
As the company achieved its net debt milestones, it began to return capital to shareholders. First, through share repurchases, and then also by announcing the introduction of a quarterly dividend in Q3 2024. Shares outstanding have been falling as a result of the share repurchases since Q3 2022.

Operating cash flow
Not surprising after looking at the netback chart, but operating cash flow is significantly improved as well.

The data and charts come from BOE Intel. Reach out here for a demo.
Hat tip to @AssetTraveller for the inspiration behind this article:
Interesting history situation: In 2018 Meg Shareholders Rejected Husky’s offer for a total Enterprise Value of $6.4B.
Over 6 years later, the Enterprise Value is the ~exact same as the offer. $MEG is surely a better company now.
— 🇨🇦Adam⛰️ (@AssetTraveller) January 24, 2025