• Sign up for the Daily Digest E-mail
  • Facebook
  • X
  • LinkedIn

BOE Report

Sign up
  • Home
  • StackDX Intel
  • Headlines
    • Latest Headlines
    • Featured Companies
    • Columns
    • Discussions
  • Well Activity
    • Well Licences
    • Well Activity Map
  • Property Listings
  • Land Sales
  • M&A Activity
    • M&A Database
    • AER Transfers
  • Markets
  • Rig Counts/Data
    • CAOEC Rig Count
    • Baker Hughes Rig Count
    • USA Rig Count
    • Data
      • Canada Oil Market Data
      • Canada NG Market Data
      • USA Market Data
      • Data Downloads
  • Jobs

Suncor Q4 results in 2 charts – visualize how the company reduced net debt by more than $13 billion from peak levels while buying back shares as well – BOE Intel

February 7, 20256:15 AM Dan Rutherford

Suncor was the first big Canadian E&P company to report its Q4/24 this week. Access the company’s press release here.

The big news was that after having reached its net debt target in Q4, Suncor has shifted its return of capital strategy to be 100% return of excess funds to shareholders via share repurchases.

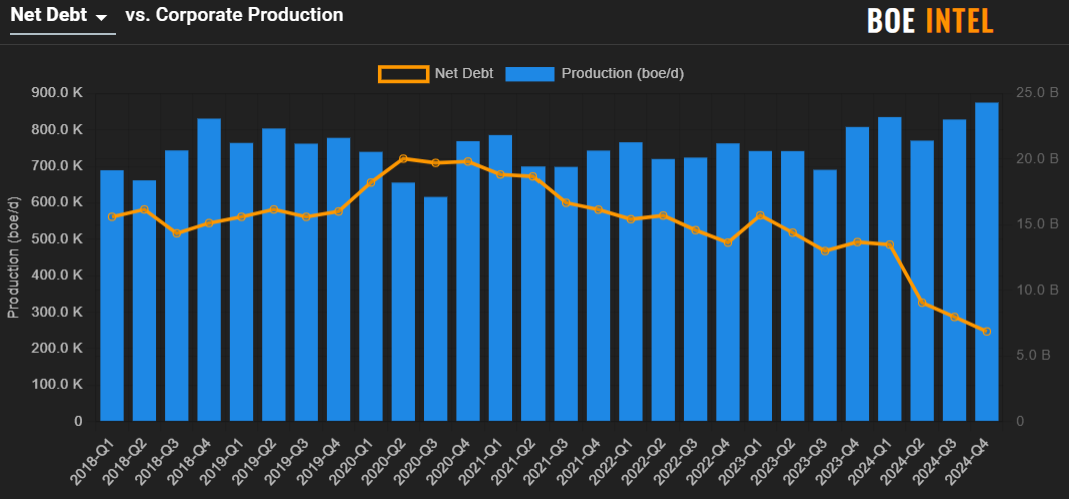
The evolution of Suncor’s net debt is quite a story, best illustrated by the chart below. Having peaked at over $20 billion after Q2 2020, the company has been able to lower net debt by more than $13 billion. As of Q4 2024, net debt now stands at $6.86 billion.

Jump to Suncor’s corporate production and financial data page on BOE Intel here.

Figure 1 – Suncor net debt vs. corporate production

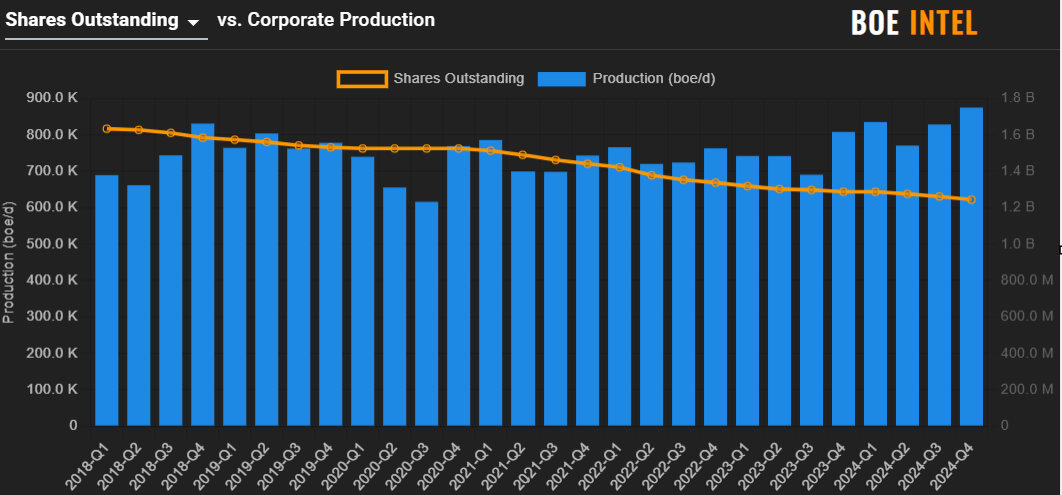
The company’s share buyback program is also another chart worth showing as it provides a good visualization as well. Having briefly paused its reduction in share count during COVID to focus on debt reduction, Suncor has shown a strong ability to continue to lower its shares outstanding over the last several years. Over the last 4 years, Suncor has been able to lower its number of shares outstanding by almost 281 million shares, or 18.4% of its shares outstanding.

With share buybacks becoming the main focus now for excess funds, it’s likely that this trend continues or even accelerates.

Figure 2 – Suncor shares outstanding vs. corporate production

StackDX Intel Suncor

Follow BOE Report
  • Facebook
  • X
  • LinkedIn

Sign up for the BOE Report Daily Digest E-mail

Successfully subscribed

Latest Headlines
  • Oil edges up, investors eye Trump statement on Russia
  • EU envoys near agreement on lower Russian oil price cap
  • Discount on Western Canada Select widens
  • European Commission proposes Russian oil price cap 15% below global price
  • US oil/gas rig count down for 11th week to lowest since 2021, Baker Hughes says

Return to Home
Alberta GasMonthly Avg.
CAD/GJ
Market Data by TradingView

    Report Error


    Note: The page you are currently on will be sent with your report. If this report is about a different page, please specify.

    About
    • About BOEReport.com
    • In the News
    • Terms of Use
    • Privacy Policy
    • Editorial Policy
    Resources
    • Widgets
    • Notifications
    • Daily Digest E-mail
    Get In Touch
    • Advertise
    • Post a Job
    • Contact
    • Report Error
    BOE Network
    © 2025 Stack Technologies Ltd.