 The war with Iran has boosted prices of globally traded natural gas by throttling exports from the Gulf. In West Texas, gas is so abundant that some producers must pay to have it taken away. The war and Iran’s attacks on Gulf energy producers have halted 20% of global liquefied natural gas (LNG) supply. Qatari LNG facilities have been damaged and tankers have been unable to sail through the Strait of Hormuz waterway at the Gulf’s entry because of Iranian threats to fire on them.
The crisis has exposed a major split in the global gas market: Import-dependent countries across Europe and Asia are scrambling for scarce supplies, but the United States – the world’s largest gas producer, consumer and exporter – remains awash in fuel, with prices near 17-month lows. But U.S. pipelines are full and LNG export plants are at capacity, so that cheap U.S. gas cannot reach overseas buyers, creating a bifurcation much more stark than in the oil markets. Since the war with Iran began on February 28, gas futures at the U.S. Henry Hub benchmark in Louisiana have dropped by as much as 12% to a 17-month low of $2.52 per million British thermal units (mmBtu), while prices around the world have soared by as much as 84% in Europe and 108% in Asia, to around $21 to $22 per mmBtu.
By contrast, the international crude benchmark Brent is trading around $111 a barrel, while the U.S. benchmark is at $104 a barrel, with both having risen more than 50% as a result of the war.
PAYING TO TAKE GAS AWAY
The United States has sufficient supply both to meet domestic demand and to fill the LNG export plants that chill gas to liquid form. However, those plants were already operating near maximum capacity before the war, so no matter how high global gas prices go, the U.S. cannot turn much more gas into LNG for export.
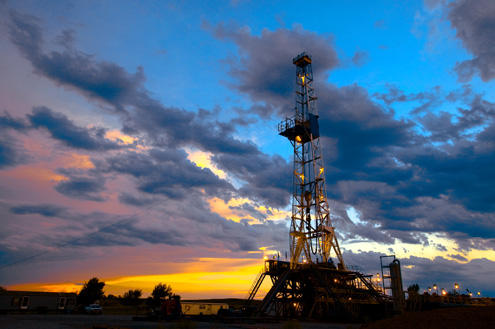
U.S. prices in the top shale field, the Permian Basin, are even lower than benchmark futures. Spot gas at the Waha Hub in West Texas has traded below zero almost every day this year, because gas pipelines out of the Permian are full, meaning there is no spare capacity to transport the fuel. Simply put, some producers have to pay others to take it away, as if it were a waste product.
U.S. gas production – already at a record 107.7 billion cubic feet per day (bcfd) in 2025 – is expected to keep rising to meet growing demand for power-hungry data centers and to supply new LNG export plants, according to a recent U.S. Energy Department outlook.
Output is increasing also as oil producers increase output – and as their wells gradually produce more gas than they used to as oil reserves are depleted. Additional pipeline capacity is months away, at best.
“Meaningful transport relief doesn’t show up until late this year or early 2027, when larger pipeline projects are anticipated to start,” analysts at Bank of America said in a report.
Some parts of the country are more exposed to high international gas prices, including New England, which must import expensive LNG and burn oil to generate power during winter months because the region lacks enough connections to the national gas pipeline grid to meet heating demand.
WINNERS AND LOSERS
Firms best able to take advantage of the global price dislocations from the Iran war, at least in the short term, have been those with excess LNG to sell. To replace gas deliveries canceled by Qatar, energy firms around the world have purchased additional cargoes from U.S. LNG producers such as Venture Global, the nation’s second-biggest LNG company behind Cheniere Energy.
“Venture Global is (relatively) new to the LNG game and had spot cargoes available to put out to the highest bidder,” said Bob Yawger, director of energy futures at Mizuho. “Suddenly everybody needs LNG now that QatarEnergy is out of the picture.”
U.S. LNG capacity will almost double over the next five years from around 18 bcfd in 2025 to around 35 bcfd in 2030, based on the plants currently under construction.
U.S. gas producers who sell to LNG companies, however, have not fared as well because they sell much of their output at the domestic price, which in addition to near-record production, has been held down by weak spring demand and ample supply in storage. Low U.S. prices have even prompted some energy firms, such as EQT, the second-biggest U.S. gas producer behind Expand Energy, to cut output while they wait for demand and prices to rise later in the year.
“Our strategic curtailments act as a form of storage, keeping gas in the ground (during) seasonally low periods of demand,” EQT CFO Jeremy Knop told analysts last week after the company reported earnings.
(Reporting by Scott DiSavino in New York and Curtis Williams in Houston; Editing by Liz Hampton and Edmund Klamann)