This article is sponsored content, written and paid for by the advertiser. We do not endorse or take responsibility for the accuracy of the information presented. It has not been reviewed by our editorial team, and the opinions expressed are solely those of the sponsor.
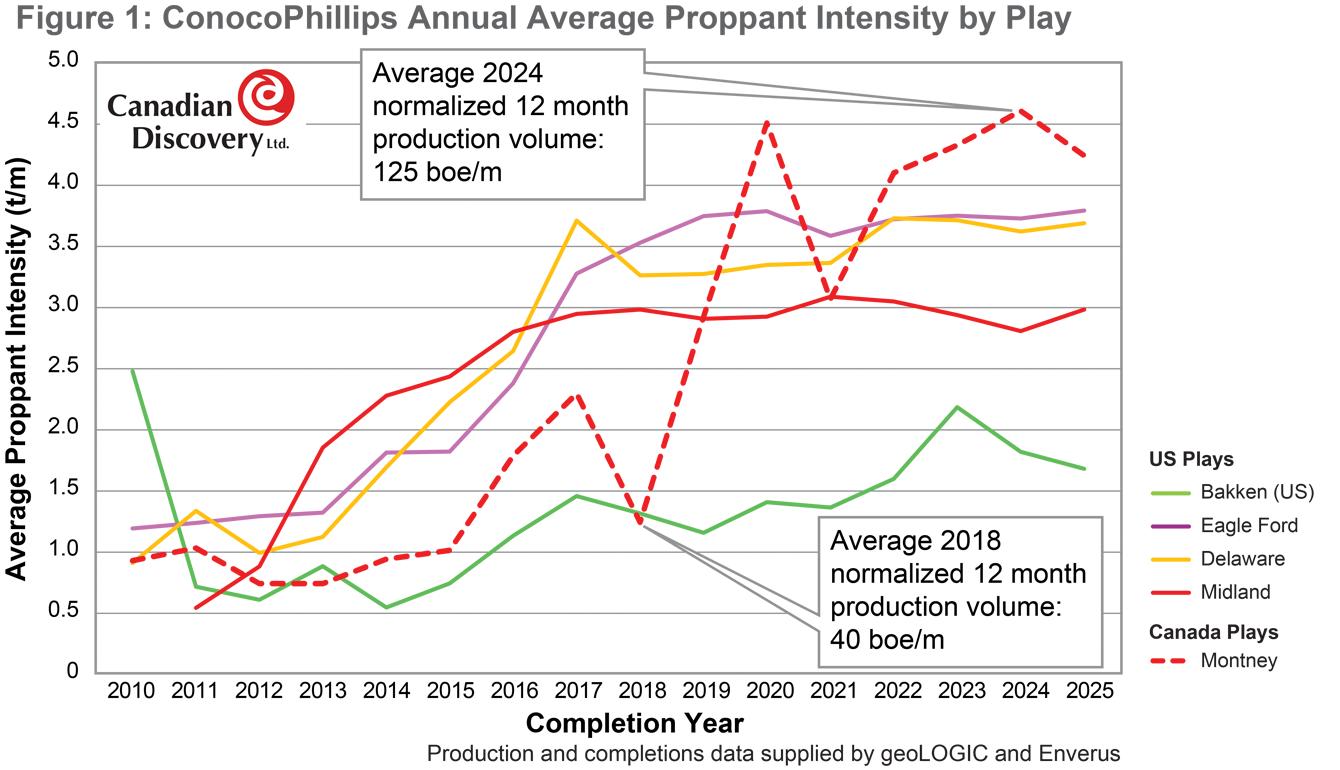
ConocoPhillips is a rare example of an operator active in the Montney (at Inga in NE BC) as well as several major US plays (the Eagle Ford, Bakken and Permian (both Delaware and Midland sub-basins)). ConocoPhillips’ Montney average proppant intensity values were below that of its US plays until 2018, as shown in Figure 1, when the company drastically increased its Montney intensities. At roughly 4.3 t/m, ConocoPhillips’ average Montney proppant intensity (based on 2025 data) now sits higher than that of any of its American plays (and also that of any other Montney operator), while normalized production has significantly improved.
Taking all operators into account, average proppant intensity has risen in 11 major unconventional plays (nine American and two Canadian), between 2010 and 2025, but as shown in Figure 2, the Montney has consistently lagged other plays in this metric. There are significant contrasts between the plays, as may be expected from their areal and stratigraphic distribution. However, they also share several similarities as “unconventional” targets. Porosity and permeability ranges largely overlap, and all these plays show some degree of overpressure. They are all fine grained, typically shaly, albeit with widely varying amounts of organic content, silica and carbonate (even within individual plays). Target zones are relatively thick, typically in the tens of metres or more, with the US Bakken being a thinner outlier.
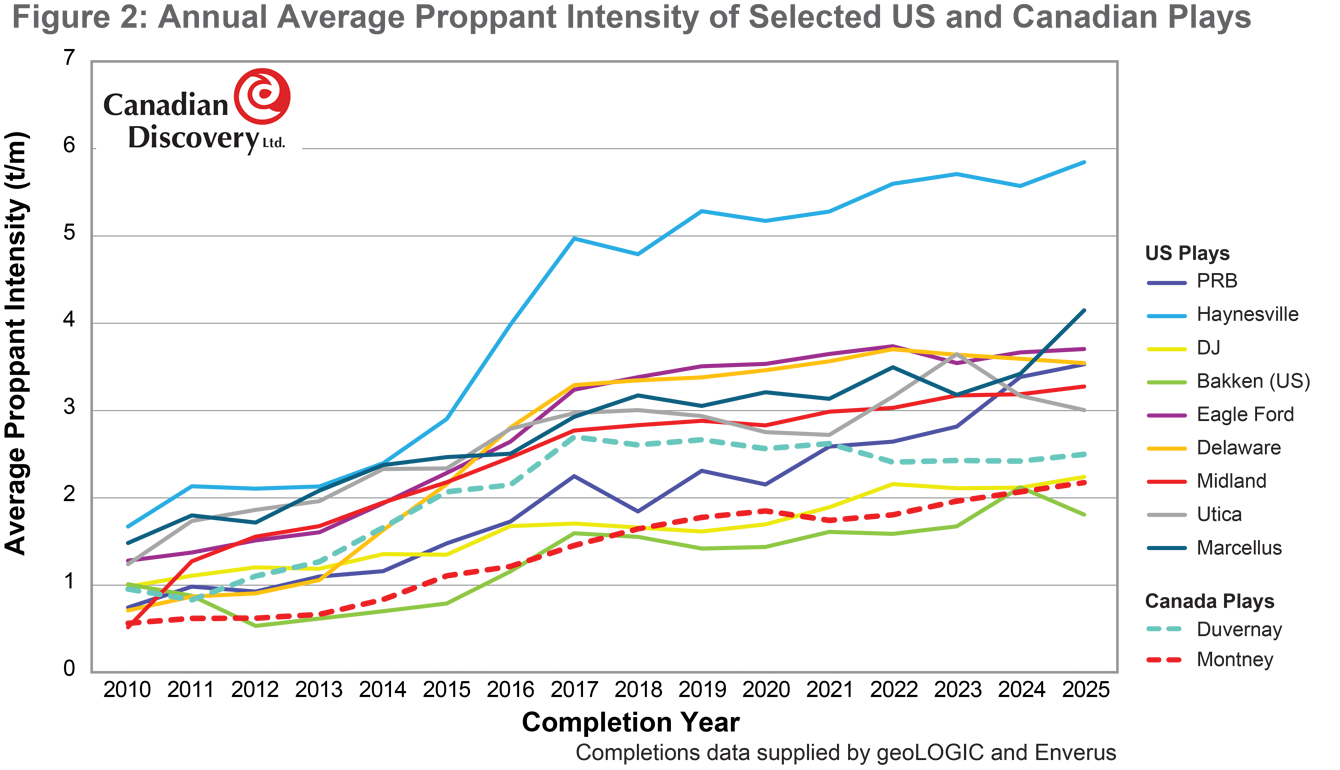
Several US plays, specifically the Permian, Appalachian, Haynesville and Eagle Ford, surpassed the current (2025) average Montney proppant intensity of roughly 2.1 t/m over a decade ago (between 2013 and 2016), under similar economic conditions. This time frame coincides with the highest year-over-year increases in normalized 12-month production volumes for the Permian, Appalachian and Eagle Ford plays. So… could Montney operators see significant production gains and benefit economically if proppant intensities were to increase to match those of their US counterparts, like ConocoPhillips has already done?
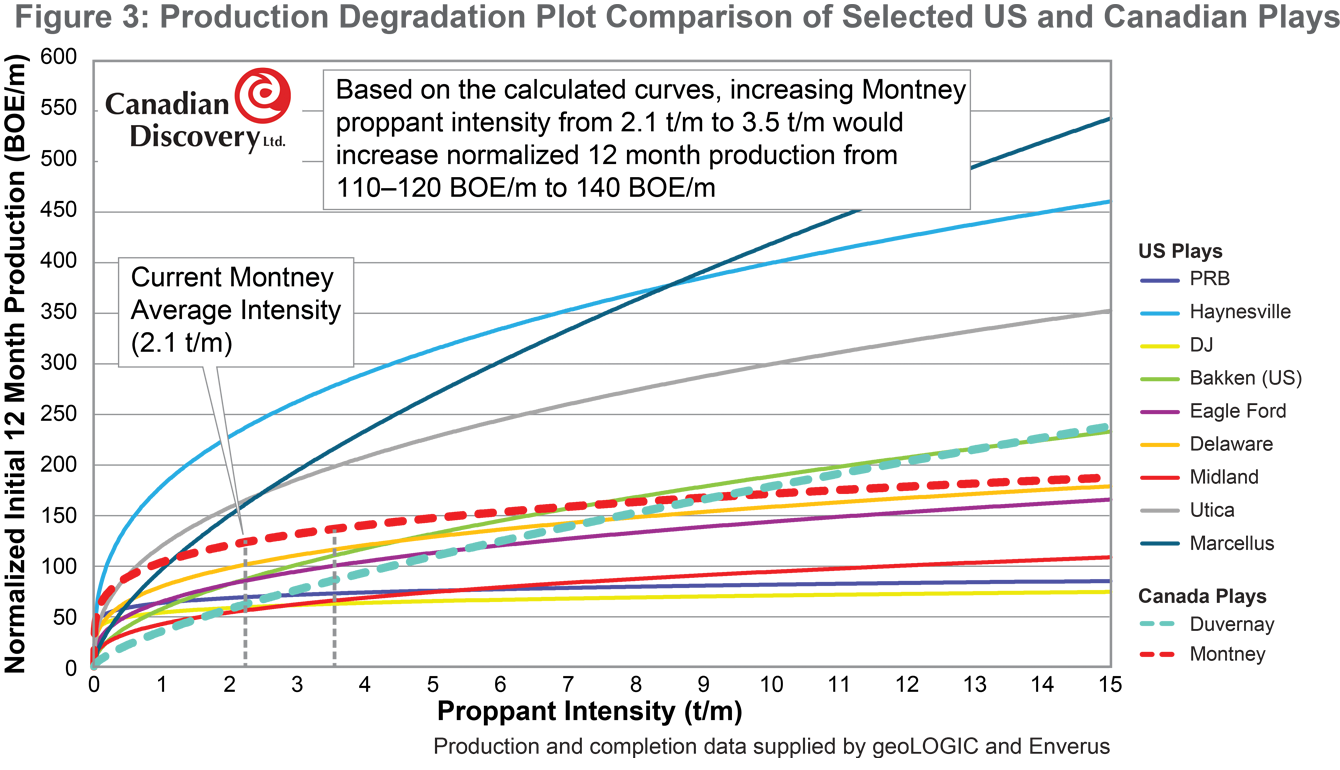
Figure 3 illustrates the positive, but non-linear relationship between proppant intensity and normalized 12-month production volumes (BOE) in the Montney and the other ten subject plays; as intensity increases, there is growth in production, but this growth gets smaller as intensity increases, following a power law curve. Based on these non-linear power law curves, the benefit of increased proppant intensity on production is not as large for the relatively liquids-rich Montney as it is for the US gas-rich plays (the Haynesville, Utica and Marcellus), but is more similar to that experienced by the US oil-weighted plays, such as the Permian and Eagle Ford. As such, an increase of 67% from the current Montney average proppant intensity of 2.1 t/m to 3.5 t/m (the current average proppant intensities in the Permian and Eagle Ford) would raise normalized 12-month production volumes by 20%.
Of course, adding more proppant to a well has cost implications, but the fact that many US plays have been using higher proppant intensities than the Montney at scale for many years suggests that there is economic merit to the idea, especially since normalized production volumes in some of these plays are less than that of the Montney.
There are several other uncertainties to address. Setting aside geomechanical concerns that may arise from significantly increased proppant intensities, there is a simple lack of Montney wells with proppant intensities that compare to their American counterparts; this affects the confidence we can have in the Montney curve shown in Figure 3 at higher intensity values (say, more than 3.5 t/m). Over time, more high-proppant intensity data points for the Montney could very well show a different relationship with production than what the current calculation curve shows. Given the similarities of the Montney to the US analogue plays, and the relative size and consistency of the high-intensity data points from the US plays (150,000 total wells over the 15 year analysis period with 30,000 using intensities above 3.5 t/m, completed by some of the largest and most technically advanced operators in North America), there is no immediately apparent reason why similar “US style” completion techniques would not improve the production and economic performance of Montney wells, as has already been shown by ConocoPhillips.
Other considerations include the need for more water (frac fluid) to go along with a proppant intensity increase; Montney slurry concentrations (kg proppant per m3 of frac fluid) are already high (250 kg/m in 2025) compared to the other subject plays (ranging from 100-175 kg/m in 2025).
The Montney is unique compared to US plays in that it is considered a “gas” play, but liquids make up a significant part of its production stream. This necessitates a different production strategy than that of most US plays, where either oil or gas is the primary objective. Anecdotally, some Montney operators restrict the early flow of their gas wells to maintain gas liquids rates; if they were allowed to flow to their full potential, 12-month volumes would be higher, but liquids rates would decline quicker. Under this assumption, the lower 12-month volumes of the restricted wells are “artificially” dragging down the Montney curve shown in Figure 3. Unfettered production would likely show a much more positive relationship between proppant intensity and production for the Montney.
Given the similarities in the unconventional plays in North America and the highlighted trends from the extensive sample size provided by US analogues, more Montney operators should try taking a page out of the ConocoPhillips completions playbook. Essentially all US plays, with reservoir characteristics similar to those of the Montney, have shown that significantly higher proppant intensities can be used to economic benefit. Additional data plots and details of the comparison between Montney and US completion operations, as well as a discussion of Duvernay completions can be found in a recent CDL Digest article, available as a free download.
About Canadian Discovery Ltd.
Canadian Discovery Ltd. (CDL) is a global leader in subsurface intelligence, headquartered in Calgary, Alberta. For over 35 years, we’ve combined geoscience and engineering expertise to deliver reservoir- to basin-scale evaluations — assessing subsurface geology, pressure, fluid flow, fluid chemistry, and geomechanics for clients worldwide.
Today, CDL is at the forefront of the energy transformation, applying our deep subsurface knowledge to Carbon Capture, Utilization and Storage (CCUS), geothermal energy, critical minerals, hydrogen production, and water solutions. We don’t just understand what’s beneath the surface — we unearth the opportunities within it. Learn more at canadiandiscovery.com.

info@canadiandiscovery.com
+1 403 269 3644
Suite 1600, 700 9 Avenue SW
Western Canadian Place – South Tower
Calgary, AB T2P 3V4