What Does the Face of Montney Hydrodynamics Look Like 10 Years Later?
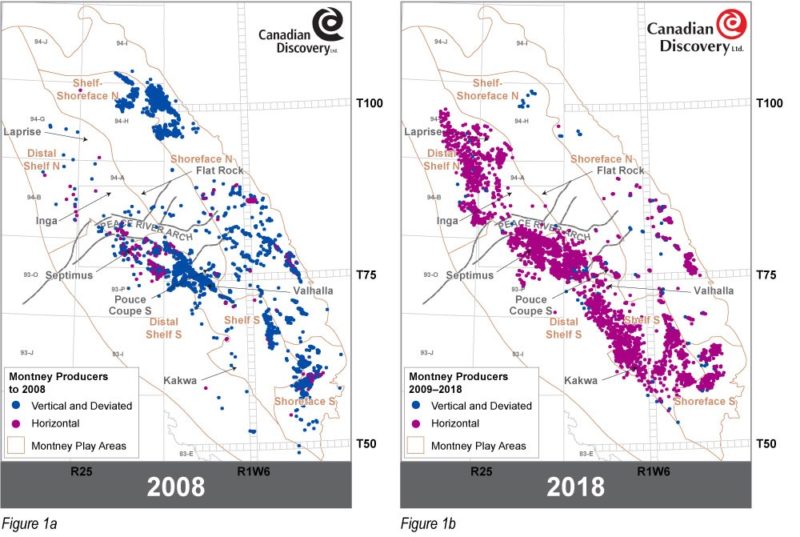
The Montney Distal Shelf South and North and Shelf South siltstone resource plays were in their infancies in 2008 when Canadian Discovery released its first Montney Hydrodynamics study. Vertical wells had successfully developed conventional gas and oil plays in the high permeability turbidite deposits around Valhalla /Pouce Coupe S and along the various subcrop edges in the coquinas and other high permeability shoreface facies on the eastern side of the play. Figure 1a and 1b show the rapid expansion of horizontal production from 2008 to December 2018 as the resource plays evolved.
Delineating gas liquids fairways is one of the new faces of hydrodynamics. Determining the location of these fairways requires a combination of pressure/depth, isotherm, source rock maturity and Wet Gas Index (WGI) mapping.
WGI is the relative percent of hydrocarbon gases with carbon numbers greater than C1 in relation to total hydrocarbon gases. Figure 2a is the Montney WGI (and the data used to create it) as mapped by CDL in 2008. All four Montney zones are included in the interpretation. From T80, R14W6 and north, data are scarce. While there is an indication of a liquids-rich area from Septimus and then north over the Peace River Arch towards Flat Rock and Inga, it is very poorly defined. There were no data at Kakwa to predict the liquids bonanza that Seven Generations is currently developing.
CDL recently released its third iteration of Montney Hydrodynamics as there has been significant drilling since 2008, and also since CDL’s second iteration was released in 2014. The Montney North play was almost non-existent in 2008 and only in the early stages of delineation in 2014. The proliferation of wells and data have allowed WGI to be evaluated for all four Montney zones. Figure 2b shows one of the four new faces of the Montney WGI that CDL has mapped in the current study. In the Upper Middle Montney, there are significantly more data to
map along the entire Montney trend. Other parameters such as pressure/depth gradient and isotherm mapping and Tmax source rock maturity data were also used to predict and map WGI. Current mapping suggests that there is untapped liquids potential north of Laprise towards Tommy Lakes.

Other Montney hydrodynamic mapping in the current study that has changed significantly from 10 years ago, mostly due to increased data (and different interpretation methods), includes pressure/depth gradients, isotherms and total dissolved solids. Montney hydrodynamics has aged gracefully!
For more information on Montney Hydrodynamics, please contact Canadian Discovery at 403.269.3644 or info@canadiandiscovery.com.