Growth in North American crude oil production (including lease condensate) contributed to record global production of 75.6 million barrels per day (bbl/d) in 2012 (see animated map). In 2012, global production increased by 2%, as production rebounded in Africa and Asia and accelerated in North America. The Middle East produced 24.1 million bbl/d of crude oil in 2012, the most of any region. Historically, most of the production growth has been in the Middle East.
Note: Crude oil production includes lease condensate.
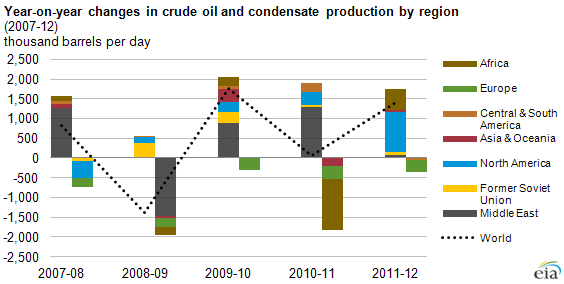
Some recent regional trends in crude oil (including lease condensate) production are described below:
Middle East: After a 1.5 million bbl/d decline in 2009, production in the Middle East increased about 900,000 bbl/d in 2010 as the global economy started to emerge from the recession. Production rose another 1.3 million bbl/d in 2011. In 2012, production growth was nearly flat at 0.3%, and the region’s annual average production reached 24.1 million bbl/d. While production growth slowed in most of the region, new export infrastructure contributed to a 14% increase in Iraq’s oil production in 2012. Middle East production gains in many countries, however, were offset by declines in Syria, Qatar, and also Iran, where sanctions targeting the oil sector contributed to a 17% decrease in the country’s production .
Former Soviet Union: Regional production reached 12.6 million bbl/d in 2010, its highest annual level since 1988, which predated the breakup of the Soviet Union. Regional production rose by about 150,000 bbl/d to 12.7 million bbl/d between 2010 and 2012, with Russia—the world’s second largest crude oil and lease condensate producer—driving this growth. Russia’s production gains since 2009 resulted mainly from the development of eastern Siberia oil fields, use of advanced technologies and improved recovery techniques in mature fields inwestern Siberia, and development of new export infrastructure.
North America: Average annual production, which dipped to 10.4 million bbl/d in 2008, climbed to 12.2 million bbl/d by 2012. The rise in production was largely the result of rising production in tight oil formations in the United States but also includes increased bitumen and synthetic crude oil production from oil sands in Canada. Mexico’s production declined steadily.
Africa: In 2011, Africa’s production declined by more than 13%, largely because of a supply outage in Libya. In 2012, Libya’s production recovered, and African production grew by 6% to 9.1 million bbl/d despite a supply outage in South Sudan. New production from some non-OPEC (Organization of the Petroleum Exporting Countries) countries, such as Ghana and Niger, also bolstered the region’s oil production since 2010.
Asia and Oceania: Production in Asia and Oceania declined by 2% to 7.6 million bbl/d in 2011 and remained at that level in 2012. Production in most of Asia and Oceania fell in both 2011 and 2012. However, production in China, the region’s largest producer, rose by 2% in 2012 partly because the Peng Lai field, which was offline in 2011, returned to production.
Central and South America: Production in Central and South America rose by 3% in 2011 and declined by 1% in 2012, to 6.6 million bbl/d, as production contracted in Brazil and Argentina, and slowed throughout most of the region.
Europe: Europe’s production has been on a downward trend since production in the North Sea began to decline before 2000. The rate of decline, which averaged 5% annually between 2000 and 2010, increased to a 9% annual decline in both 2011 and 2012. Steeper declines in 2011 and 2012 were mainly driven by a number of severe unplanned outages in the United Kingdom as well as recent increases to tax rates for the nation’s oil and gas sector.
Watch an animation video below:
<iframe width=”480″ height=”360″ src=”http://www.youtube.com/embed/47_J5df4Cmc” frameborder=”0″ allowfullscreen></iframe>
Source: EIA (June 2013)