• Sign up for the Daily Digest E-mail
  • Facebook
  • X
  • LinkedIn

BOE Report

Sign up
  • Home
  • StackDX Intel
  • Headlines
    • Latest Headlines
    • Featured Companies
    • Columns
    • Discussions
  • Well Activity
    • Well Licences
    • Well Activity Map
  • Property Listings
  • Land Sales
  • M&A Activity
    • M&A Database
    • AER Transfers
  • Markets
  • Rig Counts/Data
    • CAOEC Rig Count
    • Baker Hughes Rig Count
    • USA Rig Count
    • Data
      • Canada Oil Market Data
      • Canada NG Market Data
      • USA Market Data
      • Data Downloads
  • Jobs

After seeing this chart, it’s easy to understand why oil prices crashed so hard

July 24, 20163:30 PM Josh Groberman0 Comments

There are many reasons why oil prices crashed, however, one chart sticks out the most when seeking the primary catalyst for the price drop.

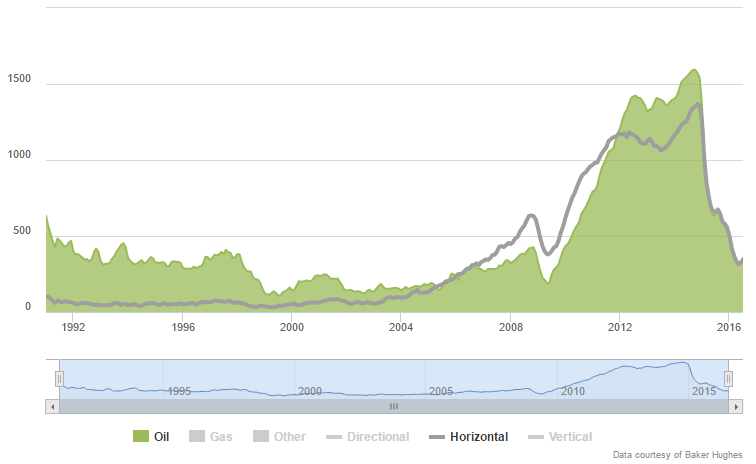
The United States rig count, developed by Baker Hughes, is one of the major barometers of the oil and gas industry. When oil prices are high, there are typically many rigs drilling for oil, and when prices are lower, rig rates follow suit.

But what happens when oil prices are high and newly developed drilling techniques are deployed?
An unprecedented spike in drilling.

The above chart not only highlights oil rigs, but also rigs that are drilling horizontally. Which makes the chart even harder to comprehend. Not only did oil rig counts rise 3-4 times historic levels, but the vast majority of these rigs were drilling horizontally–which exponentially adds more oil volumes into the market. Couple that with hydraulic fracturing and there’s the perfect storm for an oil price collapse.

There has been a major decline in drilling recently, but a balanced market will still take time to achieve. Simply removing drilling rigs from the equation does not solve the glut overnight.

Could the United States once again add rigs at the pace of 2009-2012? Might be best to watch this chart to figure that out.

Josh Groberman is the Publisher of the BOE Report – The Source for oil & gas news and information

Follow BOE Report
  • Facebook
  • X
  • LinkedIn

Sign up for the BOE Report Daily Digest E-mail

Successfully subscribed

Latest Headlines
  • Discount on Western Canada Select widens
  • European Commission proposes Russian oil price cap 15% below global price
  • US oil/gas rig count down for 11th week to lowest since 2021, Baker Hughes says
  • Taiwan’s CPC Corp eyes US shale gas assets, sources say
  • Saudi Arabia complying fully with voluntary OPEC+ target, energy ministry says

Return to Home
Alberta GasMonthly Avg.
CAD/GJ
Market Data by TradingView

    Report Error


    Note: The page you are currently on will be sent with your report. If this report is about a different page, please specify.

    About
    • About BOEReport.com
    • In the News
    • Terms of Use
    • Privacy Policy
    • Editorial Policy
    Resources
    • Widgets
    • Notifications
    • Daily Digest E-mail
    Get In Touch
    • Advertise
    • Post a Job
    • Contact
    • Report Error
    BOE Network
    © 2025 Stack Technologies Ltd.