CALGARY, Aug. 8, 2018 /CNW/ – Surge Energy Inc. (“Surge” or the “Company”) (TSX: SGY) announces its operating and financial results for the quarter ended June 30, 2018.
Based on excellent development drilling results in all three of Surge’s core areas, together with successful waterflood results at Shaunavon and Eyehill, the Company’s Q2/18 production significantly exceeded management’s budgeted expectations.
In Q2/18 Surge’s production averaged 17,072 boepd (81 percent oil and liquids) – which is very close to the Company’s 2018 production exit rate guidance of 17,175 boepd. This exciting operational result was 10 percent above Surge’s budgeted expectations, and was accomplished during spring break-up where the Company had a reduced drilling program.
Surge has now revised upward the Company’s production guidance five times in the last 23 months – two times organically, and three times relating to accretive Sparky core area acquisitions. In the last eight financial quarters Surge has now grown the Company’s production per share by over 34 percent.
As a result of the Company’s consistent quarterly production per share growth, combined with higher oil prices, Surge’s adjusted funds flow per share in Q2/18 increased by 38 percent as compared to Q1/18.
Surge’s budget for adjusted funds flow in Q2/18 was $28.8 million; and the Company’s actual adjusted funds flow for Q2/18 came in 34 percent higher than budget at $38.6 million.
The Company’s current production exceeds Surge’s 2018 exit production guidance estimate of 17,175 boepd; with 60 percent of the Company’s 2018 drilling program remaining.
HIGHLIGHTS
- Surge’s Q2/18 quarterly production of 17,072 boepd increased by 13 percent over Q2/17 production of 15,125 boepd (10 percent per share).
- Surge’s Q2/18 quarterly production increased by seven percent over Q1/18 production of 16,027 boepd (eight percent per share).
- Adjusted funds flow in Q2/18 was $38.6 million, an increase of 43 percent as compared to Q2/17 at $27.0 million.
- Adjusted funds flow per share in Q2/18 was $0.167, an increase of 39 percent over Q2/17 at $0.120 per share.
- Adjusted funds flow of $38.6 million in Q2/18 increased 37 percent as compared to Q1/18 at $28.2 million.
- Adjusted funds flow per share in Q2/18 of $0.167 increased 38 percent over Q1/18 at $0.121 per share.
- Crude oil and liquids production increased by 14 percent – from 12,200 barrels per day in Q2/17 to 13,899 barrels per day in Q2 2018.
- The Company’s unhedged operating netback increased by over 32 percent, to $31.92 per boe in Q2/18, from $24.12 per boe in Q2/17.
- The Company generated over $9.5 million of free adjusted funds flow in the quarter, which drove an all-in payout ratio of 75 percent.
- Surge maintained a simple dividend payout ratio of less than 15 percent in Q2/18.
- Maintained a net debt to adjusted funds flow ratio of 1.78 times.
- In Q2/18, Surge finalized a large increase in the Company’s bank line to $350 million from $305 million. This significant increase provides the Company with more than $100 million of pro-forma liquidity on its bank line as at June 30, 2018.
- On May 31, 2018, Surge closed the acquisition of high netback, waterflooded, crude oil producing assets in the Company’s core Sparky area of Central Alberta for a purchase price of $28.4 million. Production in Surge’s Sparky core area has now increased 145 percent over the last two years, from 2,850 boepd to over 7,000 boepd (85 percent oil) today.
FINANCIAL AND OPERATING SUMMARY
|
Three Months Ended June 30, |
Six Months Ended June 30, |
|||||
|
($000s except per share amounts) |
2018 |
2017 |
% Change |
2018 |
2017 |
% Change |
|
Financial highlights |
||||||
|
Oil sales |
83,516 |
54,216 |
54 % |
148,008 |
102,410 |
45 % |
|
NGL sales |
2,486 |
2,282 |
9 % |
4,947 |
4,522 |
9 % |
|
Natural gas sales |
1,092 |
4,275 |
(74)% |
2,429 |
8,291 |
(71)% |
|
Total oil, natural gas, and NGL revenue |
87,094 |
60,773 |
43 % |
155,384 |
115,223 |
35 % |
|
Adjusted funds flow1 |
38,596 |
27,018 |
43 % |
66,765 |
48,658 |
37 % |
|
Per share basic ($) |
0.17 |
0.12 |
42 % |
0.29 |
0.22 |
32 % |
|
Capital expenditures – petroleum & gas properties2 |
23,344 |
15,064 |
55 % |
58,253 |
49,105 |
19 % |
|
Capital expenditures – acquisitions & dispositions2 |
28,939 |
35,716 |
nm(4) |
22,454 |
35,447 |
nm |
|
Total capital expenditures2 |
52,283 |
50,780 |
3 % |
80,707 |
84,552 |
(5)% |
|
Net debt at end of period3 |
276,140 |
208,061 |
33 % |
276,140 |
208,061 |
33 % |
|
Operating highlights |
||||||
|
Production: |
||||||
|
Oil (bbls per day) |
13,343 |
11,522 |
16 % |
12,897 |
10,913 |
18 % |
|
NGLs (bbls per day) |
556 |
678 |
(18)% |
558 |
681 |
(18)% |
|
Natural gas (mcf per day) |
19,038 |
17,547 |
8 % |
18,585 |
17,425 |
7 % |
|
Total (boe per day) (6:1) |
17,072 |
15,125 |
13 % |
16,553 |
14,498 |
14 % |
|
Average realized price (excluding hedges): |
||||||
|
Oil ($ per bbl) |
68.78 |
51.71 |
33 % |
63.40 |
51.85 |
22 % |
|
NGL ($ per bbl) |
49.15 |
36.99 |
33 % |
48.99 |
36.69 |
34 % |
|
Natural gas ($ per mcf) |
0.63 |
2.68 |
(76)% |
0.72 |
2.63 |
(73)% |
|
Netback ($ per boe) |
||||||
|
Oil, natural gas and NGL sales |
56.06 |
44.16 |
27 % |
51.86 |
43.91 |
18 % |
|
Realized gain (loss) on commodity contracts |
(2.46) |
(0.75) |
nm |
(1.81) |
(1.15) |
57 % |
|
Royalties |
(8.36) |
(5.58) |
50 % |
(7.32) |
(5.61) |
30 % |
|
Operating expenses |
(14.16) |
(12.98) |
9 % |
(14.37) |
(13.44) |
7 % |
|
Transportation expenses |
(1.62) |
(1.48) |
9 % |
(1.45) |
(1.52) |
(5)% |
|
Operating netback |
29.46 |
23.37 |
26 % |
26.91 |
22.19 |
21 % |
|
G&A expense |
(2.06) |
(1.95) |
6 % |
(2.14) |
(1.94) |
10 % |
|
Interest expense |
(2.56) |
(1.79) |
43 % |
(2.50) |
(1.70) |
47 % |
|
Corporate netback |
24.84 |
19.63 |
27 % |
22.27 |
18.55 |
20 % |
|
Common shares outstanding, end of period |
230,494 |
225,766 |
2 % |
230,494 |
225,766 |
2 % |
|
Weighted average basic shares outstanding |
230,812 |
225,766 |
2 % |
231,904 |
225,765 |
3 % |
|
Stock option dilution |
5,265 |
3,790 |
nm |
4,407 |
3,598 |
nm |
|
Weighted average diluted shares outstanding |
236,077 |
229,556 |
3 % |
236,311 |
229,363 |
3 % |
|
1 |
Management uses adjusted funds flow (cash flow from operating activities before changes in non-cash working capital, decommissioning expenditures, transaction costs and cash settled stock-based compensation) to analyze operating performance and leverage. Adjusted funds as presented does not have any standardized meaning prescribed by IFRS and, therefore, may not be comparable with the calculation of similar measures for other entities. |
|
2 |
Please see capital expenditures discussion throughout this press release. |
|
3 |
The Company defines net debt as outstanding bank debt plus or minus working capital, however, excluding the fair value of financial contracts and other current obligations. |
|
4 |
The Company views this change calculation as not meaningful, or “nm”. |
EIGHT QUARTERS OF PER SHARE GROWTH
Based on better than anticipated drilling and waterflood results in the Company’s three core areas at Sparky, Valhalla, and Shaunavon, Surge’s Q2/18 average production of 17,072 boepd significantly exceeded management’s budget expectations, and all street estimates.
Surge’s current production exceeds the Company’s 2018 production exit rate guidance estimate of 17,175 boepd (82 percent oil and liquids); with 60 percent of Surge’s 2018 drilling program remaining.
The Company has now delivered production per share growth of 34 percent over the last eight financial quarters, while maintaining a net debt to adjusted funds flow ratio of under two times:

Surge’s significant production per share growth, combined with higher crude oil prices, is driving large increases in the Company’s unhedged adjusted funds flow, and unhedged adjusted funds flow per share. In Q2/18 Surge generated unhedged adjusted funds flow per share of $0.184, an increase of 44 percent as compared to $0.128 in Q1/18:

Surge’s budget for adjusted funds flow in Q2/18 was $28.8 million; and the Company’s actual adjusted funds flow for Q2/18 came in 34 percent higher than budget at $38.6 million.
SURGE’S GROWTH/ DIVIDEND/ FREE ADJUSTED FUNDS FLOW YIELD/ CAPITAL GAIN BUSINESS MODEL
In the context of today’s rising crude oil price business environment, Surge management is excited to remind the Company’s shareholders of the many total rate of return components, and the substantial tax benefits, associated with Surge’s multi-faceted, low risk business model.
Management’s conservative business model provides:
- low risk, six to seven percent annual production per share growth (10 percent in Q2/18), plus;
- an increasing, compounding dividend (~four percent per share yield), plus;
- a substantial, effectively after-tax, free adjusted funds flow yield (five percent per share based on Q2/18 crude oil prices), plus;
- a compelling capital gain opportunity (Surge’s independent Sproule year end 2P before tax NAV is $6.06 per share).
Furthermore, in addition to the above total rate of return components, examples of the very beneficial tax efficiencies associated with Surge’s low risk, growth/compounding dividend/ free adjusted funds flow/capital gain business model are set forth below1:
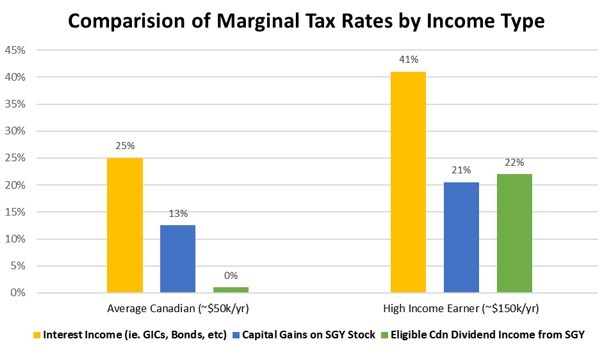
Comparison of Marginal Tax Rates by Income Type (CNW Group/Surge Energy Inc.)
|
Comparison of AB Marginal Tax Rates by Income Type |
||
|
Average Canadian |
High Income Earner* |
|
|
Interest Income (i.e. GICs, Bonds, etc) |
25% |
41% |
|
Capital Gains on SGY Stock |
13% |
21% |
|
Eligible Cdn Dividend Income from SGY |
0.0% |
22% |
*Note: For those shareholders in the highest marginal tax bracket in Alberta; capital gains and eligible dividends are approximately 50% and 34% more tax-effective, respectively, as compared to interest income.
Surge is able to provide the very tax-efficient returns set forth above as a result of the Company’s substantial, high graded, tax pool base (currently estimated to be in excess of CAD $1.0 billion), which provides an internally estimated tax horizon of more than five years, based on Sproule’s new June 30, 2018 crude oil price deck (i.e. no significant cash tax payments anticipated).
|
______________________ |
|
|
1 |
The above comparisons are based on Company internal estimates and are illustrative for tax purposes. Each investor has their own risk/reward tolerance, income tax criteria, and investment requirements. Please consult your investment and/or tax advisor. |
In the current environment of rising taxes, Surge is pleased to be able to deliver the above, “after tax”, efficient returns to its shareholders.
OPERATIONAL MOMENTUM CONTINUES – UPDATE
As discussed above, Surge exceeded management’s budgeted production expectations for Q2/18 by 10 percent. Production in Q2/18 averaged 17,072 boepd (81 percent oil and liquids), compared to the Company’s internal budget of 15,579 boepd, and analyst consensus on the street of 16,250 boepd.
During the spring break-up quarter in Q2/18, Surge implemented a reduced drilling program, with all-in capital expenditures of $23.3 million. Surge’s Q2/18 program included the drilling of 5 wells (5 net), together with associated capex for infrastructure, land and seismic. The Company experienced a 100 percent success rate for the Q2/18 drilling program.
In early June, the Company began its 2H/18 drilling program where Surge plans to drill and complete a total of 25 wells in its three core areas, including 16 Sparky area wells, 6 Shaunavon wells, and 3 Valhalla wells.
As part of the Sparky core area program, Surge will be drilling four, 100 percent working interest wells at the Company’s exciting, new, 80 million net barrel internally estimated original oil in place (“OOIP”2), Sparky discovery at Betty Lake. The Company internally estimates more than 35 follow-up locations at Betty Lake.
In addition, Surge will also be drilling 3 more wells at its large 75 million net barrel internally estimated OOIP, Sparky pool at Provost, to follow up on Surge’s last 5 Provost wells – which are averaging 165 percent of type curve. The Company internally estimates more than 40 follow-up locations at Provost.
Management attributes the Company’s continued quarterly operational outperformance to be a direct result of applying growth capital to Surge’s high quality, operated, large OOIP, light and medium gravity crude oil, sandstone reservoirs at the Company’s three core areas of Sparky, Valhalla, and Shaunavon.
OUTLOOK – CONSISTENT QUARTERLY PER SHARE GROWTH
Management’s stated goal is to be the best positioned, top performing, light/medium gravity crude oil growth and dividend paying public company in our peer group in Canada.
Surge issued no treasury shares during the protracted downturn for world crude oil prices. Now the Company’s significant production per share growth over the last eight financial quarters, combined with higher oil prices, is driving large increases in the Company’s unhedged adjusted funds flow, and unhedged adjusted funds flow per share (please refer to the graph above).
|
__________________________ |
|
2 Original Oil in Place (OOIP) is the equivalent to Discovered Petroleum Initially In Place (DPIIP) for the purposes of this press release. |
Surge continues to maintain the Company’s track record over the last eight financial quarters of delivering:
- consistent successful drilling and waterflood results;
- increasing production per share by more than 34 percent;
- increasing unhedged adjusted funds flow per share by over 120 percent;
- increasing Surge’s dividend three times – by a cumulative 31 percent (while maintaining a simple payout ratio of under 20 percent); and
- upwardly revising production estimates five times (two times organically, and three times relating to core area Sparky acquisitions).
Surge focuses on sustainability, balance sheet management, and cost controls to deliver returns to Surge shareholders. The Company continues to grow its production base and 11 year drilling location inventory in its three core areas of Sparky, Shaunavon, and Valhalla – in accordance with management’s strategic Five Year Business Plan – through low risk development drilling results, waterfloods, and strategic, high quality, large OOIP, core area acquisitions.