Wet Gas Index as a Proxy for Liquids Richness?
In this era of under-reported or unreported gas liquids production, could the Ethane+ also known as the C2+ Wet Gas Index (WGI) serve as a proxy to indicate liquids richness? The C2+ WGI could be useful as there are often more wells with gas analyses than with reported liquids production. To explore this idea, Upper Montney C2+ WGI values are compared with the condensate-gas ratio (CGR) and IP90 oil rates from Upper Montney producers.
The C2+ WGI is the relative mole percent of hydrocarbon gases with carbon numbers greater than or equal to C2 in relation to total hydrocarbon gases:
C2+ WGI = ∑C2 + C3 + … + C10 mole% / ∑ C1 + C2 + … + C10 mole%
The progression of gas evolved during the thermal maturation of kerogen is well known (Tissot and Welte, 1978; Hunt, 1996; Ferri et al., 2003). In the oil window, liquid hydrocarbons and natural gas liquids are the dominant hydrocarbons produced. With increasing temperature, lower molecular weight natural gas liquids dominate (wet gas window) and are generated from source rock kerogen and in situ cracking of oil. The oil and wet gas windows result in relatively high WGI values ranging from 5 to 30%. With greater thermal maturation, dry hydrocarbons are produced with a resulting WGI less than 5% (Canadian Discovery Ltd., 2013).
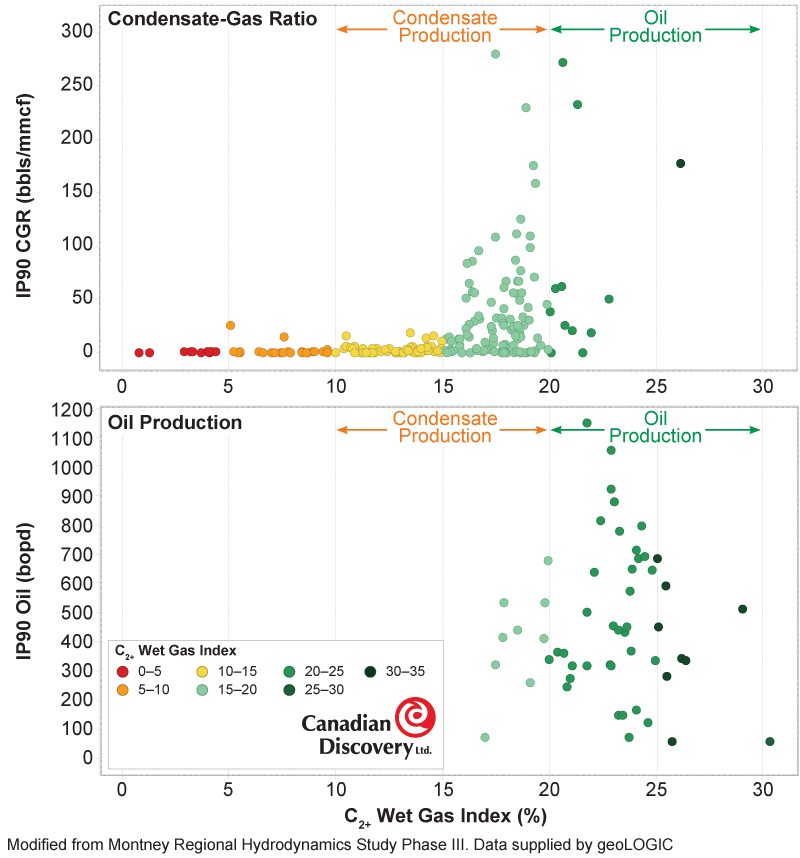
The plot shows an example of how C2+ WGI values support observed liquids production. The C2+ WGI values from Upper Montney horizontal wells in the map area are plotted against their IP90 CGR or IP90 oil production rate. The CGR starts to increase around 10% WGI and becomes significant at 15% WGI. By approximately 20% WGI, condensate production has dropped off and the wells are producing oil (Canadian Discovery Ltd., 2019).
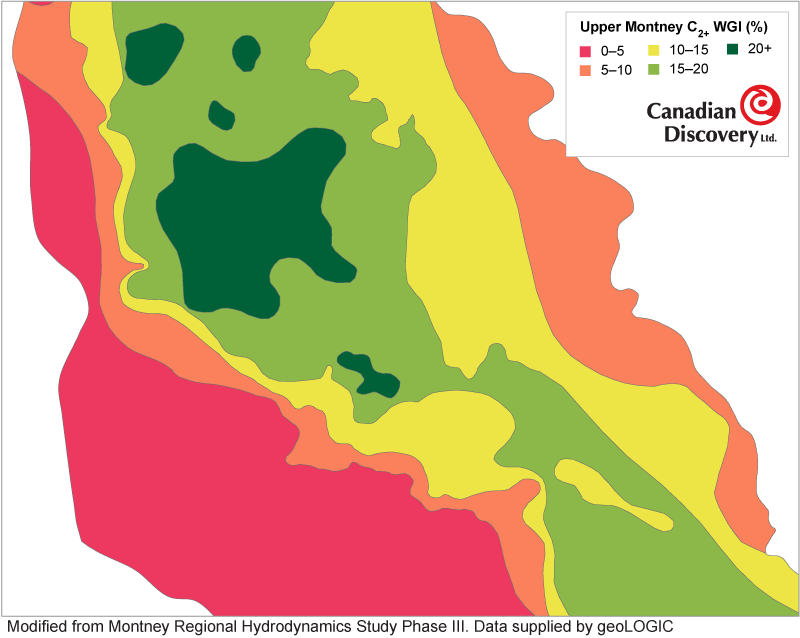
The Upper Montney C2+ Wet Gas Index map shows a liquids-rich fairway through the heart of the Montney. The fairway is well defined by gas analysis data in areas of high well density and can be considered a good guide to gas liquids production. In less-developed areas where contouring was informed by Montney isotherms and source rock maturity data, the map is more speculative.
Canadian Discovery Ltd.’s (CDL) recently completed 2019 Montney Hydrodynamics Study examines the relationships between pressure, temperature and hydrocarbon fluid chemistry in the Montney reservoir. Click here to learn more and find out how this study can help you.
References
CDL. 2019. Montney Regional Hydrodynamics Study Phase III.
CDL. 2013. WCSB Gas Liquids and Light Oil Fairways.
Ferri, F., Hayes, M. and Nelson, A. 2013. Liquids potential of the Lower to Middle Triassic Montney and Doig formations, British Columbia; in Geoscience Reports 2013, British Columbia Ministry of Natural Gas Development, p1–11.
Hunt, J.M. 1996. Petroleum geochemistry and geology. 2nd Edition. W.H. Freeman and Co., New York. p743.
Tissot, B.P. and Welte, D.H. 1978. Petroleum formation and occurrence. A new approach to oil and gas exploration. Springer Verlag, New York. p538.