
Each week, XI Technologies scans its unique combination of enhanced industry data to provide trends and insights that have value for professionals doing business in the WCSB. If you’d like to receive our Wednesday Word to the Wise in your inbox, subscribe here.
A few weeks ago, we presented data on reclamations done in Western Canada over a period of six months by way of highlighting some of the most important environmental liability work being done in our industry. Due to the response we’ve received from that article, we’ve decided to follow it up with a deeper look at this data to provide a more complete picture of the state of reclamations in the WCSB for the past half-year.
This data looked at the past six months of reclamations in Alberta, Saskatchewan, and British Columbia (data from Manitoba was not available) and is based on the license status change for a site. To clarify, this is not necessarily reflective on when the work was done, but rather when the status changed according to the regulators (i.e., when the site has officially been “reclaimed”).
Reclamations in Western Canada
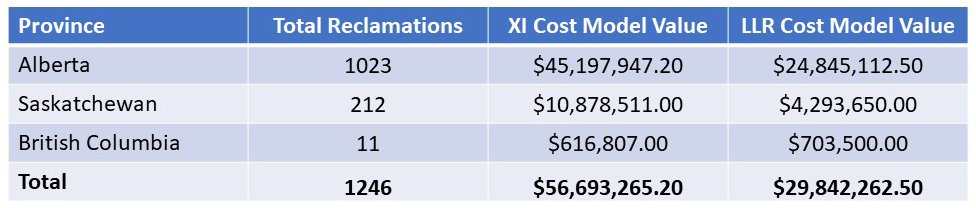
As a reminder, these were the totals from the past six months as presented in our previous article. The values for these reclamations come from calculations using the cost models embedded in XI’s ARO Manager.
For a closer look at these data, here’s a dashboard view of our findings:

Beyond the raw totals for reclamations per operator, it’s also instructive to look at which operators are reclaiming the greatest percentage of their total portfolio of wells. Here’s the top ten operators by the percentage impact of reclamations on their well counts.

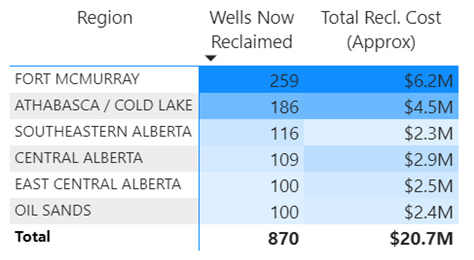
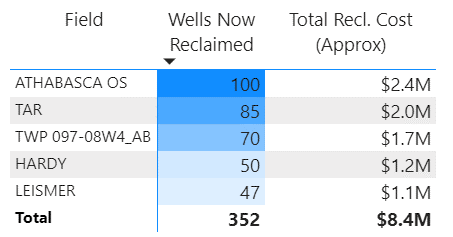
Here’s a more targeted look at where reclamations are being done, beyond just breaking down by provinces. Note: these costs are approximated using XI’s proprietary ARO cost model and do not reflect actual costs. The ARO cost model within AssetBook ARO Manager was developed through a culmination of government resources, expert opinion and industry data. ARO Manager uses this cost model to help clients estimate, analyze, and monitor ARO.
Where are Reclamation Funds Being Directed

Regions with the Most Reclamation Activity
Fields with the Most Reclamation Activity
Orphan Well Association
Another big part of the reclamations puzzle is the work done by the Orphan Well Association (OWA). Funded primarily by industry, the OWA’s job is to close wells, facilities and pipelines that do not have a solvent and responsible owner—known as orphans—to protect people and the environment and remove the potential risk of unfunded liability. The OWA is an independent, non‐profit organization that operates under the delegated legal authority of the Alberta Energy Regulator (AER).
If the OWA were an operator, their 49 reclamation certifications within this time period would have ranked them in a tie for the fifth-most licenses changed to reclaimed.
This data was calculated using XI’s liability software module, AssetBook ARO Manager. ARO Manager is the only standardized tool for estimating and monitoring asset retirement obligations in Western Canada’s oil and gas sector. You can learn how one company saved significant time in their liability calculations by implementing AssetBook ARO Manager, you can download a case study. To learn how XI’s ARO Manager can help with the planning and reporting of liability management, visit our website or contact us for a demo.