U.S. gas prices have climbed to their highest level in more than a decade as strong demand from overseas has emptied storage and left inventories well below average for the time of year despite a mild winter.
Front-month futures for gas delivered at Henry Hub in Louisiana have risen to $6.40 per million British thermal units, the highest in real terms since 2010.
Wholesale prices in the United States are still far below those prevailing in Northeast Asia ($33 per million British thermal units) and Northwest Europe ($34).
Full price convergence is prevented by the limited liquefaction capacity for exports from the United States and regasification capacity for imports into Asia and Europe.
But shortages in other regions and fears of an interruption of supplies from Russia are pulling U.S. prices higher via increased demand and prices for LNG.
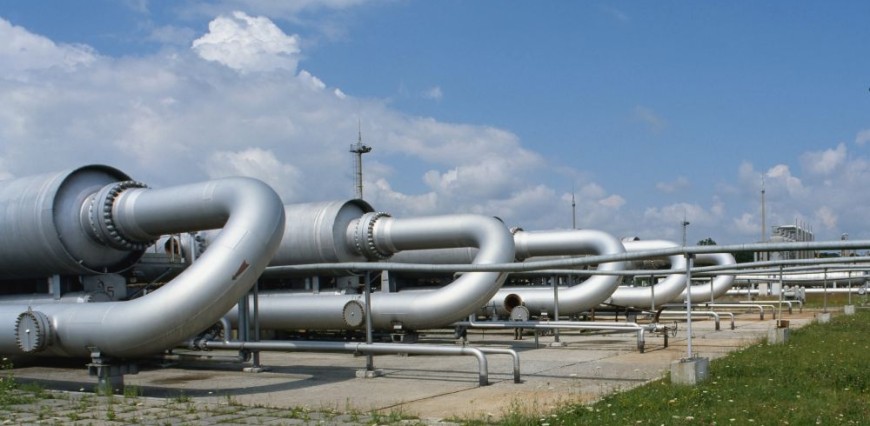
U.S. LNG exports rose 13% in the three months from November to January compared with the same period a year earlier, while gas production was up by less than 5%.
As a result, LNG exports accounted for 12% of domestic dry gas production in January 2022, up from 8% in January 2020 and 3% in January 2018.
Exports are likely to have accelerated even further in February and March after Russia’s invasion of Ukraine sent gas prices surging in Europe.
U.S. prices are still largely isolated from the rest of the world, but growing LNG exports are gradually forging closer links with Europe and Asia.
DEPLETED STOCKS
U.S. gas inventories ended the winter at just 1,382 billion cubic feet on April 1, the lowest for the time of year since 2019 and before that 2014.
Working stocks in underground storage were 316 billion cubic feet (19%) below the pre-pandemic five-year seasonal average for 2015-2019.
Because of strong exports, inventories depleted more than usual despite high prices and winter heating demand that was 8% below the long-term average.
Reflecting the low level of stocks, futures prices have moved into a strong backwardation, with nearby prices rising to reduce consumption and exports and encourage more production.
The one-year calendar spread for Henry Hub futures has steepened into backwardation of more than $2 per million British thermal units, putting it in the 99th percentile for all trading days since 2007.
Higher prices have already begun to encourage more drilling, with the number of gas-focused rigs climbing to 138 last week, up from 106 at the end of last year.
The number of gas-focused rigs is rising at the fastest rate in five years, according to an analysis of rig counts published by oilfield services company Baker Hughes.
Increased drilling should keep output growing through the end of the year and into 2023, which will be needed as demand for LNG remains high as buyers in Europe and Asia scramble to replace gas from Russia.
John Kemp is a Reuters market analyst. The views expressed are his own.