
Each week, XI Technologies scans its unique combination of enhanced industry data to provide trends and insights that have value for professionals doing business in the WCSB. If you’d like Wednesday Word to the Wise delivered directly to your inbox, subscribe here.
This week for our Area Snapshot, we decided to do a snapshot of one of Canada’s largest, historic conventional oil fields, the Pembina. Predominantly a Cardium Oil play, the field is centred on Drayton Valley and has been active since 1953.
We reviewed the Pembina in May of 2021 and activity since then has continued to remain essential to the Western Canadian Sedimentary Basin development. This long-standing field makes up a substantial chunk of several well-known companies’ production portfolios. Today, we’ll draw on XI Technologies’ enriched industry data to update a few perspectives as to what’s continuing in the Pembina.
Note: for the purposes of this article, we define the Pembina field using the boundaries defined by the AER. This may differ from other internal company definitions.
Ownership in Pembina Assets
There are 62 companies with 50% or more of their production coming from the Pembina. 17 companies own 85% of Pembina assets, but there are an additional 151 companies that are active in this area.

Figure 1 – Ownership map of the top 10 companies in the Pembina.
Click here to download a report of all companies in the Pembina.
Pembina zones
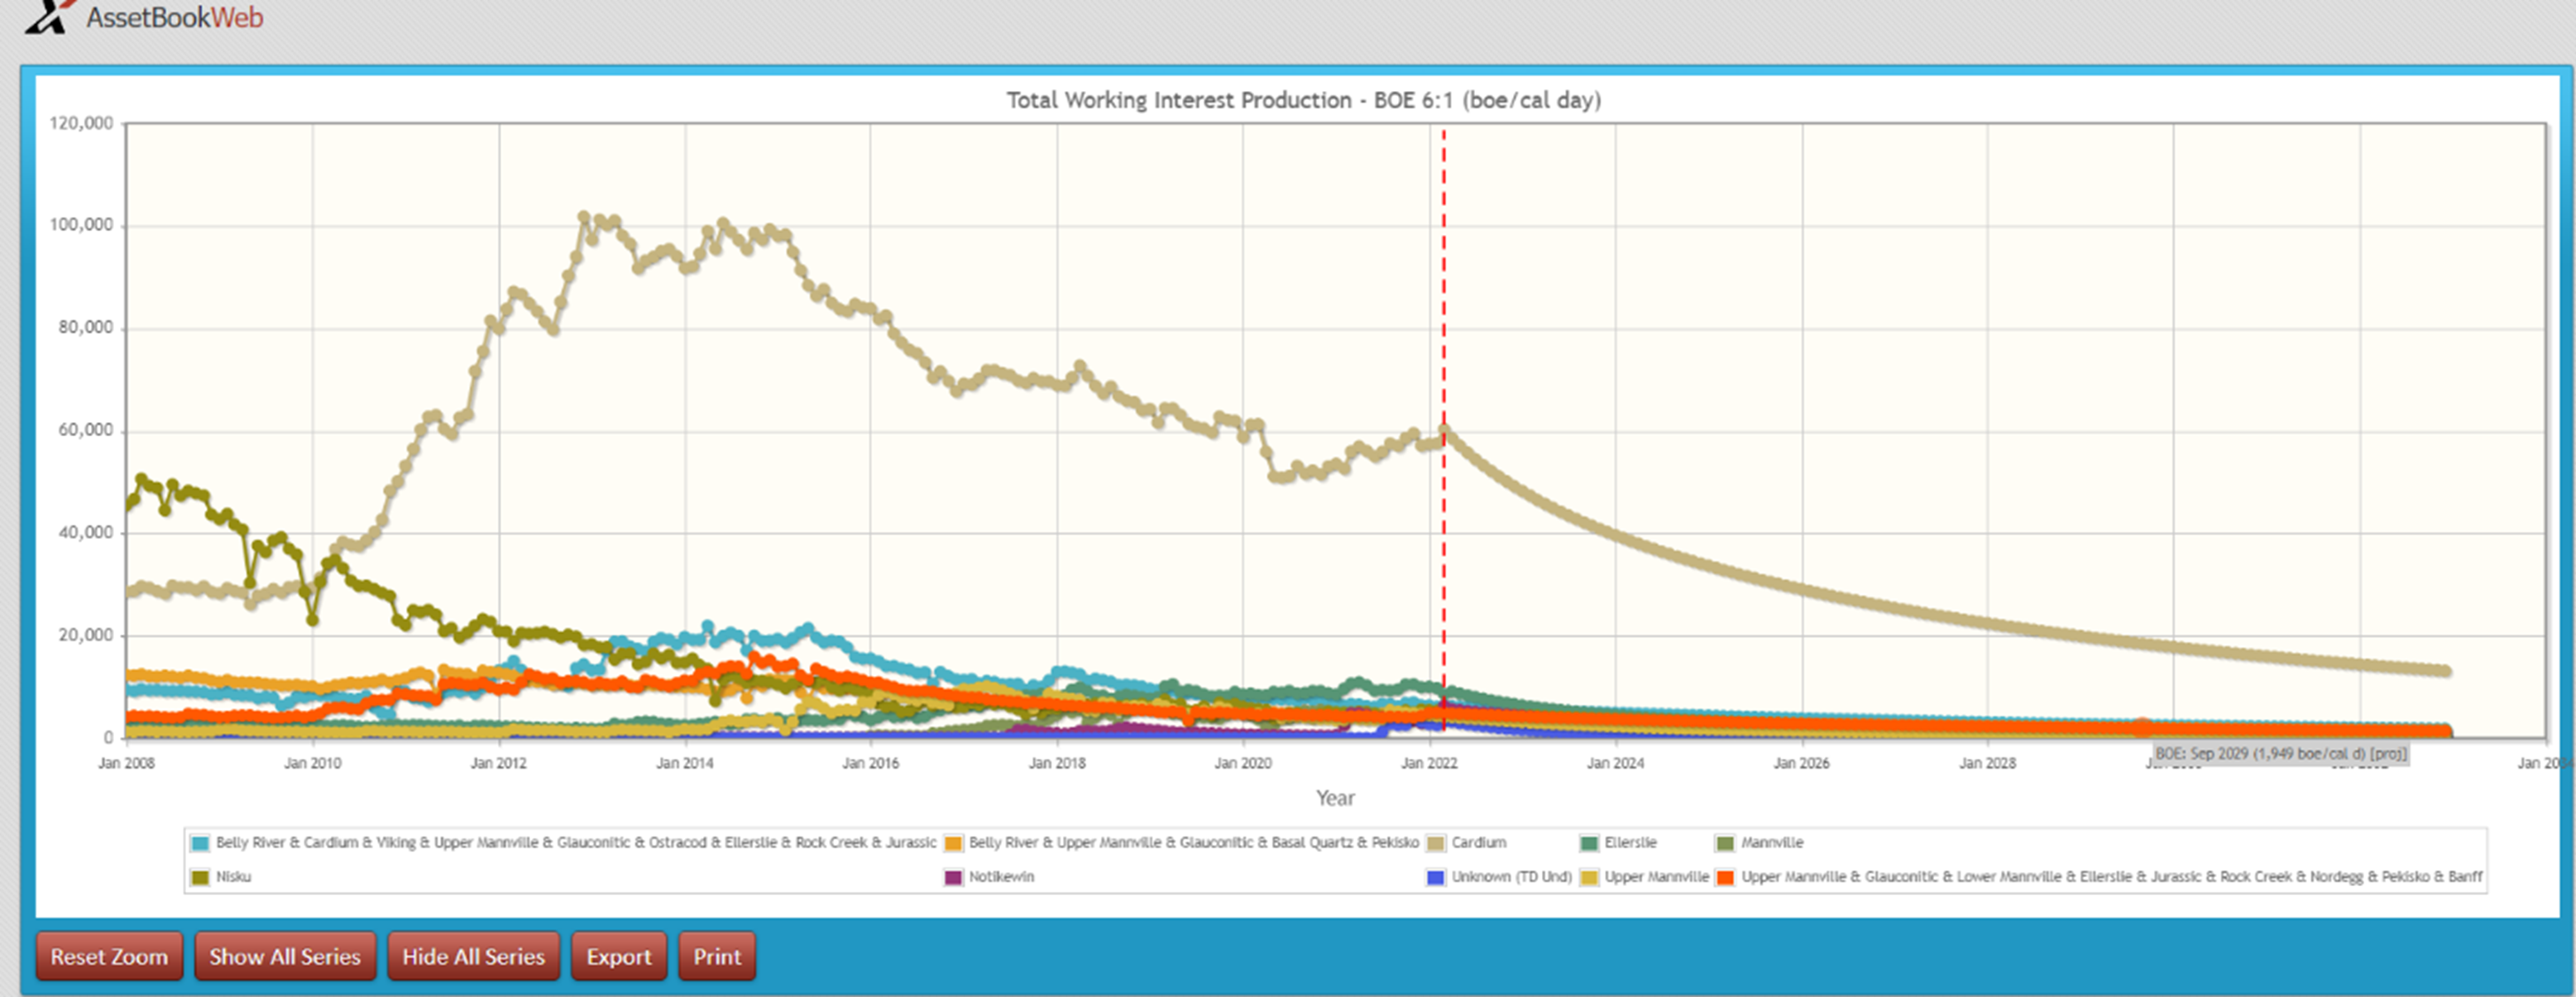
Nearly half of all production in the Pembina comes from what the government has labeled the Cardium area. The figure below charts production of the current top 10 zones in the Pembina.
Production history of Pembina assets
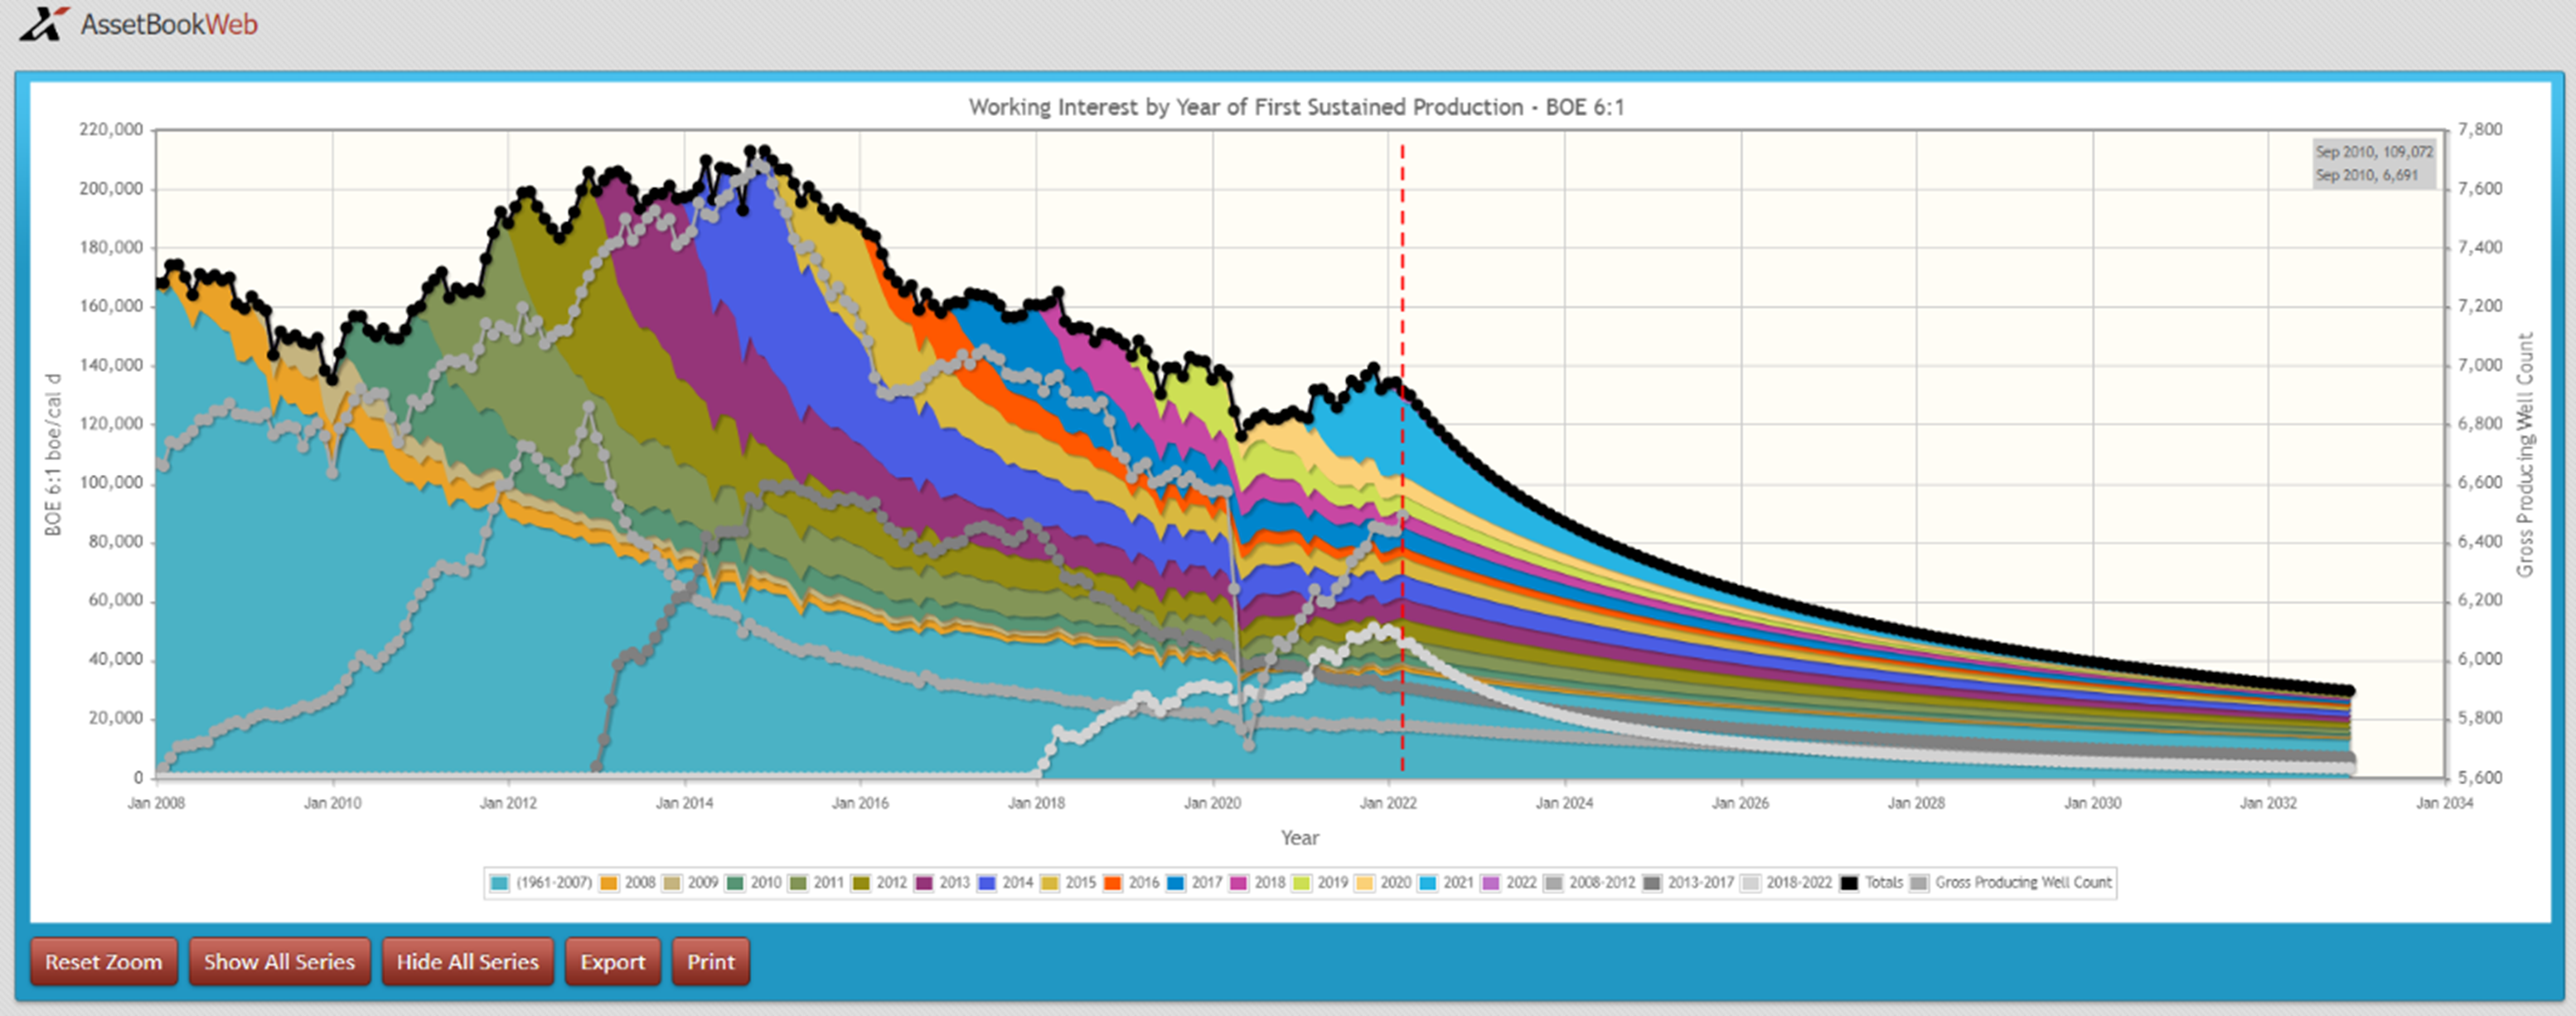
Let’s investigate the Pembina field a little further. Looking at the vintage of this production, it’s confirmed that most activity in the Pembina is legacy with a good percentage of the production coming from pre-2006 wells. However, as the graph shows, 2021 saw a resurgence in production in the field.
Liabilities in the Pembina
Because this production is older, the ARO Obligations become extremely important. If companies are hoping to acquire rich and long-lived Pembina assets, it is essential to look at liabilities among various acquisition opportunities to determine differences in future obligations.
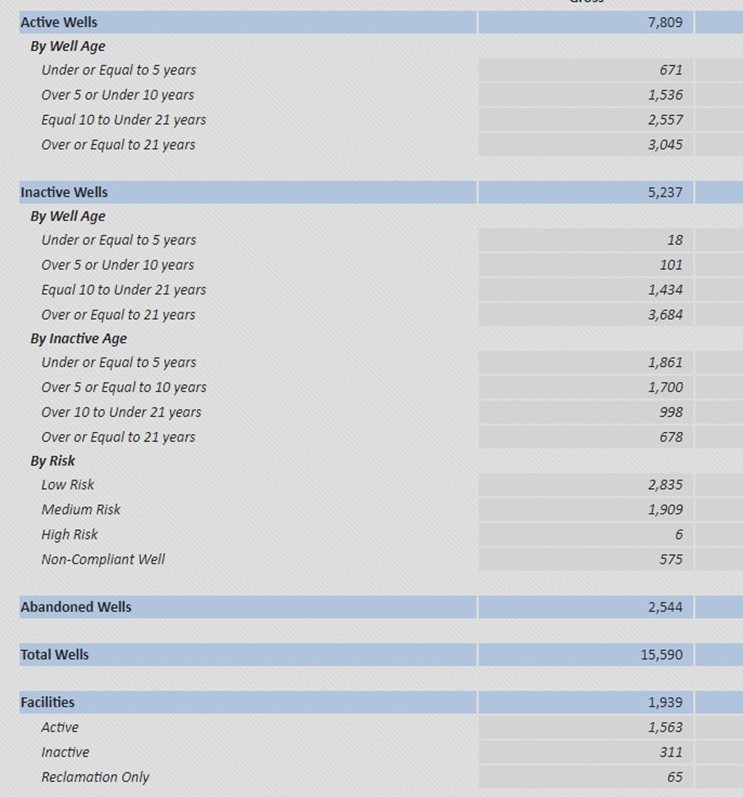
Being one of the oldest fields in Alberta, it’s no surprise there are a significant number of inactive wells in the Pembina, particularly ones over 21 years in age. There is over $940 million of liability on inactive wells in the Pembina or 5234 total inactive wells identified by the government. Our data suggests that 42 of the licenses with an AER identified inactive well still have activity, with 13 above the marginal level defined by Directive 088.
Note: Liability costs are based on XI’s ARO cost model.
Click here to download an ARO report on the Pembina.
Emissions in the Pembina
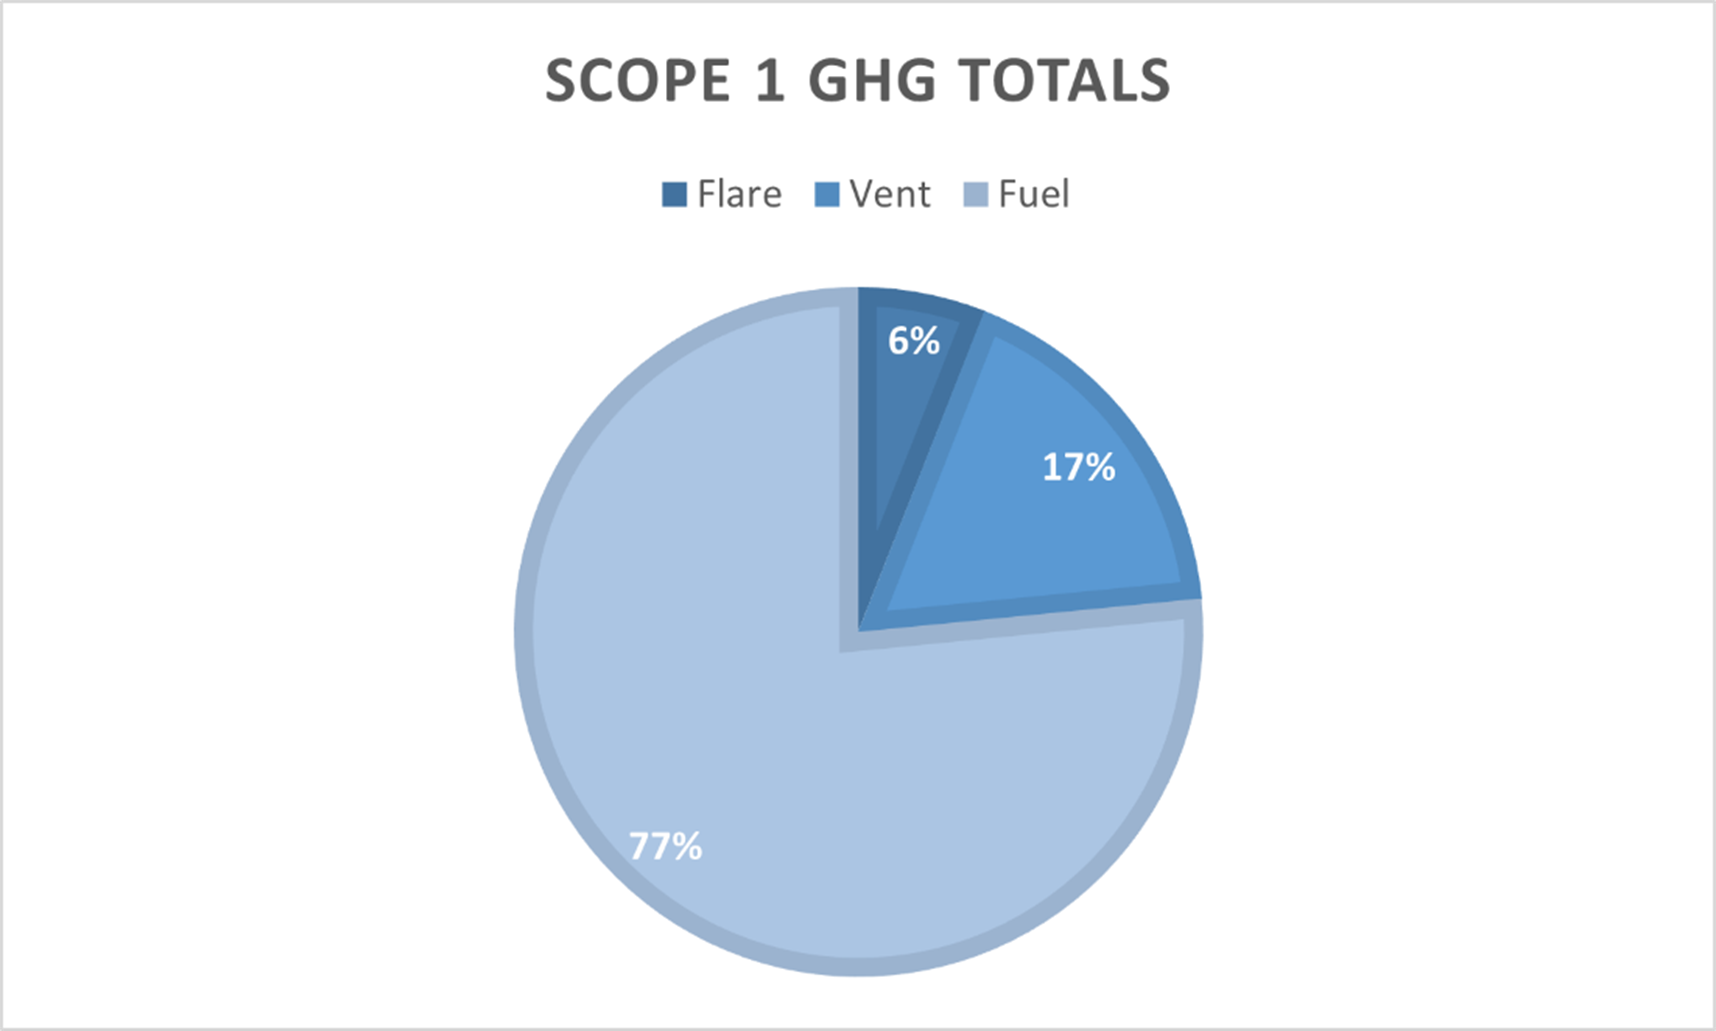
A quick snapshot of the Scope 1 GHG Emissions from the AssetBook Emissions Report for the total field shows the last 12 months have produced approximately 900K tonnes CO2e, with 40% of the emissions coming from the 10 largest gas plants or gathering systems in the area, operated by larger midstream or E&P companies.
The mature oil field has an established gas production infrastructure and has an average gas conservation rate of 97%, where only 3% of gas produced ends up as emissions. The majority of emissions are from fuel use and venting emissions outweigh flaring by almost 2 to 1.
____________________________________________________________________________________
If you’d like to learn more about how XI’s AssetSuite software can analyze companies, packages, or regions throughout Western Canada, visit our website or contact XI Technologies. If you’d like more information on how to take an over-the-fence look at emissions when evaluating opportunities, register for our upcoming XI Chat: Emissions scoping for A&D on Tuesday, June 14th. Click here for more details.