Q1 2023 was a dynamic, unpredictable quarter in the Canadian oil patch. With price volatility and unexpected constraints on production, most producers faced more challenges compared to Q4 2022. This story was by no means universal, however; many companies saw impressive expansions in production across commodities, and various cost categories appear to be normalizing after a year characterized by persistent inflationary pressures. Companies also deployed significant capital in this quarter, with 2023 capital programs coming into full swing and numerous high profile acquisitions generating headlines. As we did for Q4 2022, we’ve prepared a summary analysis for Q1 2023 using our dataset of over 40 Canadian producers. This quarter’s two-part Earnings Season Report Card will incorporate additional metrics that will soon be available on the BOE Intel platform including data on realized pricing, finance costs and more. These additions are just a sampling of the additional functionality we are aiming to add in the coming year as we work towards our goal of becoming the go-to source for information on everything in Canadian oil and gas.
Natural Gas
Natural gas production increased slightly in Q1 2023, outpacing Q4 2022 daily average levels by 1.2%. Saturn Oil’s natural gas growth was the most proportionally significant, with the company’s production growing by 326.3% quarter-over-quarter. While the company started from a relatively low baseline, Saturn completed major acquisitions in both June 2022 and January 2023. Petrus Resources also continued a streak of productivity growth; Q1 2023 was Petrus’ second consecutive quarter of natural gas production growth. This suggests that the company’s $112 million 2022 capital program, 90% of which was focused in Ferrier and North Ferrier, is generating significant results in the field. Hammerhead, the third strongest performer with 27.9% natural gas production growth, is in the middle of an organic growth push supported by a $100 million Karr infrastructure expansion as well as a 2 rig drilling program targeting 40 wells in 2023. Tourmaline, Canada’s top producer of natural gas as of May 2023, led the group with 93.3 mmcf/d in absolute production growth.
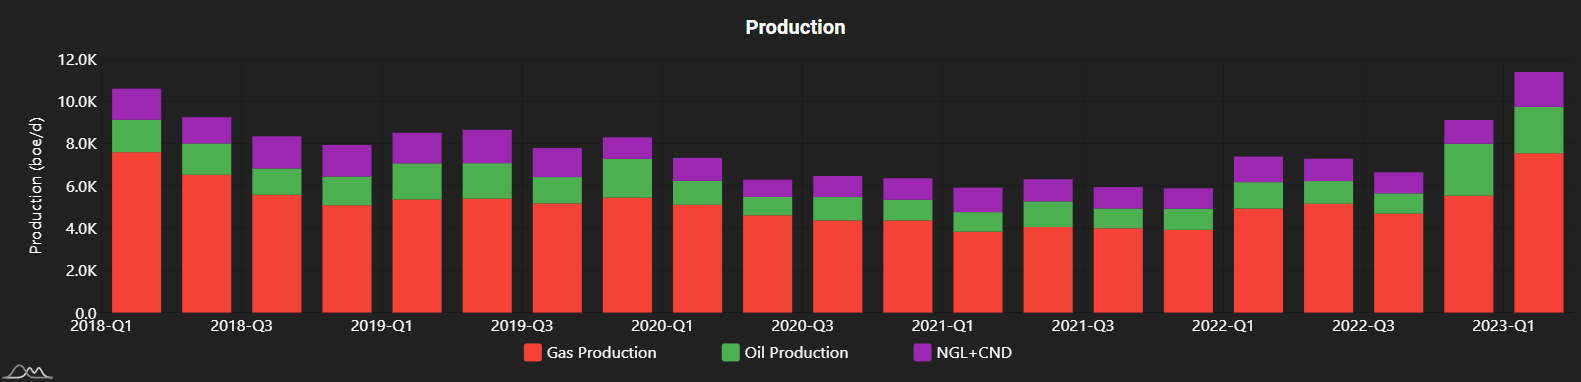
Petrus Production Graph Q1 2018 to Q1 2023
| Company Name | Q4 2022 (MMcf/d) | Q1 2023 (MMcf/d) | Absolute Change (MMcf/d) | % Change |
| Saturn | 3.0 | 12.7 | 9.7 | 326.3 |
| Petrus Resources | 33.2 | 45.2 | 12.0 | 36.3 |
| Hammerhead | 99.5 | 127.3 | 27.8 | 27.9 |
| Crescent Point | 153.6 | 171.7 | 18.1 | 11.8 |
| Headwater | 11.5 | 12.8 | 1.3 | 11.3 |
| Yangarra | 39.0 | 43.2 | 4.2 | 10.8 |
| Journey | 31.9 | 34.9 | 2.9 | 9.2 |
| Tamarack Valley | 68.4 | 74.3 | 5.9 | 8.7 |
| Spartan Delta | 273.7 | 293.8 | 20.1 | 7.3 |
| Kelt Exploration | 108.8 | 116.7 | 7.9 | 7.2 |
| Vermilion | 234.2 | 247.6 | 13.4 | 5.7 |
| Cardinal Energy | 15.2 | 16.0 | 0.8 | 5.0 |
| Advantage Energy | 299.7 | 314.3 | 14.6 | 4.9 |
| Pipestone | 118.4 | 124.1 | 5.6 | 4.8 |
| Tourmaline | 2,376.5 | 2,469.7 | 93.3 | 3.9 |
| Pieridae | 179.1 | 186.2 | 7.0 | 3.9 |
| Gear Energy | 5.1 | 5.3 | 0.2 | 3.8 |
| Obsidian Energy | 67.0 | 69.0 | 2.0 | 3.0 |
| Surge Energy | 19.6 | 20.2 | 0.5 | 2.7 |
| Kiwetinohk | 81.9 | 83.5 | 1.6 | 1.9 |
| Bonterra Energy | 31.0 | 31.4 | 0.4 | 1.4 |
| Canadian Natural Resources | 2,115.0 | 2,139.0 | 24.0 | 1.1 |
| Cenovus | 852.0 | 857.0 | 5.0 | 0.6 |
| Ovintiv | 1,561.0 | 1,555.0 | -6.0 | -0.4 |
| Paramount | 321.9 | 320.6 | -1.3 | -0.4 |
| Birchcliff | 387.6 | 383.1 | -4.5 | -1.2 |
| Crew Energy | 157.7 | 155.8 | -1.9 | -1.2 |
| Peyto | 552.6 | 544.3 | -8.3 | -1.5 |
| Enerplus | 249.4 | 245.5 | -3.8 | -1.5 |
| NuVista | 259.3 | 253.3 | -6.0 | -2.3 |
| Athabasca | 14.8 | 14.4 | -0.4 | -2.9 |
| ARC Resources | 1,310.0 | 1,264.0 | -46.0 | -3.5 |
| Lucero | 13.2 | 12.7 | -0.5 | -3.8 |
| Pine Cliff | 109.3 | 105.2 | -4.1 | -3.8 |
| Baytex | 85.7 | 82.1 | -3.6 | -4.2 |
| Perpetual | 33.0 | 30.8 | -2.2 | -6.6 |
| Whitecap | 342.6 | 313.2 | -29.5 | -8.6 |
| InPlay Oil | 25.1 | 22.6 | -2.4 | -9.7 |
| MEG Energy* | 0.0 | 0.0 | 0.0 | 0.0 |
| Imperial** | 37.0 | 0.0 | 0.0 | 0.0 |
| Suncor*** | 0.0 | 0.0 | 0.0 | 0.0 |
| Rubellite* | 0.0 | 0.0 | 0.0 | 0.0 |
| TOTAL | 12,640.7 | 12,798.5 | 157.8 | 1.2 |
| AVERAGE | 332.6 | 336.8 | 4.2 | 1.2 |
* Rubellite and MEG Energy do not report natural gas production volumes. As such, we have left both companies out of the total and average calculations.
**Imperial Oil does not provide broken out total corporate natural gas production volumes in Q1-Q3. As such, we have left Imperial Oil out of the total and average calculations.
***Suncor does not provide broken out total corporate liquids production volumes. As such, we have left Suncor out of the total and average calculations.
Liquids
With respect to liquids, average corporate production declined by 1.3% in Q1 2023. Only 1 of the top 10 liquids producers by quarter-over-quarter growth had quarterly production of more than 30,000 bbl/d in Q1, suggesting that the production decline may have mostly been on the part of larger producers. Hammerhead, a company that was also in the top 3 in terms of natural gas production growth, led the group in Q1 2023 with a 45% increase in liquids production. Rubellite, a relatively new pure play Clearwater producer with 345 net sections of prospective land, has also demonstrated steady organic production growth. Saturn Oil has grown their production base markedly in the past two years, primarily through acquisitions including a $260 million acquisition in June 2022 and a $525 million acquisition in January 2023. Saturn’s production base has also been bolstered by strong 2022 drilling performance; according to Saturn’s May 2023 corporate presentation, Saturn’s average Saskatchewan well drilled in 2022 exceeded its type curve by 19%.
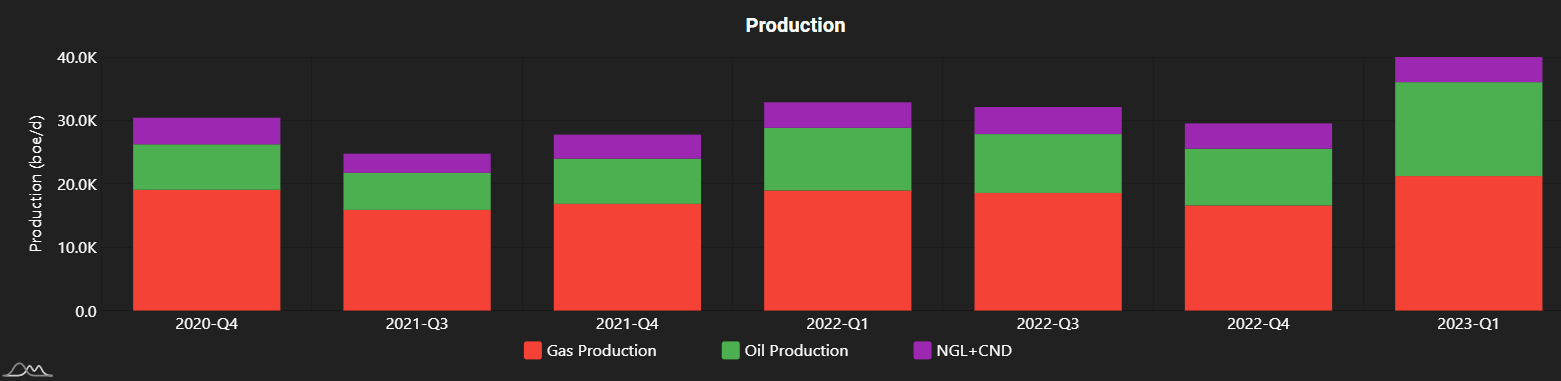
Hammerhead Production Graph Q4 2020 to Q1 2023 (select quarters do not have data available)
| Company Name | Q4 2022 (BBL/d) | Q1 2023 (BBL/d) | Absolute Change (BBL/d) | % Change |
| Hammerhead | 12,942 | 18,771 | 5,829 | 45.0 |
| Rubellite | 2,181 | 3,057 | 876 | 40.2 |
| Saturn | 12,018 | 15,672 | 3,654 | 30.4 |
| Kelt Exploration | 9,894 | 12,379 | 2,485 | 25.1 |
| Surge Energy | 18,822 | 21,776 | 2,954 | 15.7 |
| Journey | 6,173 | 7,106 | 933 | 15.1 |
| Pieridae | 4,858 | 5,441 | 583 | 12.0 |
| Headwater | 13,635 | 14,868 | 1,233 | 9.0 |
| Spartan Delta | 29,020 | 31,230 | 2,210 | 7.6 |
| Petrus Resources | 3,579 | 3,846 | 267 | 7.5 |
| Crew Energy | 6,604 | 6,998 | 394 | 6.0 |
| Obsidian Energy | 20,608 | 21,728 | 1,120 | 5.4 |
| Tamarack Valley | 52,951 | 55,556 | 2,605 | 4.9 |
| Lucero | 8,806 | 9,139 | 333 | 3.8 |
| Gear Energy | 4,906 | 5,071 | 165 | 3.4 |
| Pipestone | 14,078 | 14,485 | 407 | 2.9 |
| Advantage Energy | 5,626 | 5,765 | 139 | 2.5 |
| Canadian Natural Resources | 942,258 | 962,908 | 20,650 | 2.2 |
| Crescent Point | 108,529 | 110,665 | 2,136 | 2.0 |
| Cardinal Energy | 18,744 | 19,064 | 320 | 1.7 |
| Baytex | 72,585 | 73,082 | 497 | 0.7 |
| Paramount | 43,723 | 43,832 | 109 | 0.2 |
| Yangarra | 5,217 | 5,215 | -2 | 0.0 |
| Bonterra Energy | 8,236 | 8,223 | -13 | -0.2 |
| Tourmaline | 115,513 | 114,291 | -1,222 | -1.1 |
| Athabasca | 33,386 | 32,290 | -1,096 | -3.3 |
| MEG Energy | 110,805 | 106,840 | -3,965 | -3.6 |
| InPlay Oil | 5,441 | 5,246 | -195 | -3.6 |
| Ovintiv | 263,400 | 252,200 | -11,200 | -4.3 |
| Cenovus | 664,900 | 636,200 | -28,700 | -4.3 |
| Peyto | 12,840 | 12,205 | -635 | -4.9 |
| Whitecap | 109,285 | 102,931 | -6,354 | -5.8 |
| NuVista | 31,030 | 28,998 | -2,032 | -6.5 |
| Perpetual | 1,634 | 1,517 | -117 | -7.2 |
| Kiwetinohk | 11,087 | 10,075 | -1,012 | -9.1 |
| ARC Resources | 141,446 | 127,769 | -13,677 | -9.7 |
| Pine Cliff | 2,823 | 2,547 | -276 | -9.8 |
| Vermilion | 46,412 | 41,187 | -5,225 | -11.3 |
| Enerplus | 65,356 | 56,734 | -8,622 | -13.2 |
| Birchcliff | 15,198 | 10,734 | -4,464 | -29.4 |
| Imperial* | 435,000 | 0 | -435,000 | 0.0 |
| Suncor** | 0 | 0 | 0 | 0.0 |
| TOTAL | 3,056,549 | 3,017,641 | -38,908 | -1.3 |
| AVERAGE | 76,414 | 75,441 | -973 | -1.3 |
*Imperial Oil does not provide broken out total corporate liquids production volumes in Q1-Q3. As such, we have left Imperial Oil out of the total and average calculations.
**Suncor does not provide broken out total corporate liquids production volumes. As such, we have left Suncor out of the total and average calculations.
Total Production
Reduced pricing and unexpected disruptions, including various infrastructure and refinery outages referenced by numerous companies in their reports, applied downward pressure on production volumes. At the aggregate level, production fell by around 40,000 BOE/D in Q1 2023. This holds true for the average company, which saw a modest 0.7% decline in total production. An examination of our data suggests that many of the companies with increased average production were smaller; of the top 10 companies by production growth, only 3 produced more than 30,000 BOE/d. In terms of production growth, Saturn and Rubellite led the way once again with 42.1% and 40.2% increases respectively. With respect to absolute production expansion, CNRL led the group with over 27,000 BOE/d in total production growth this quarter.
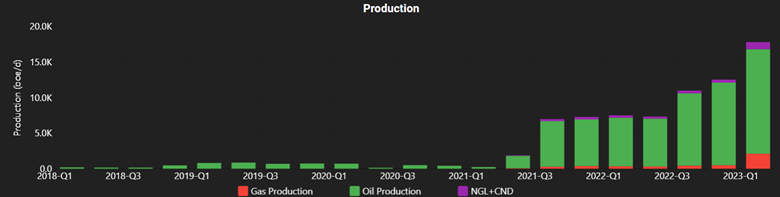
Saturn Production Graph Q1 2018 to Q1 2023
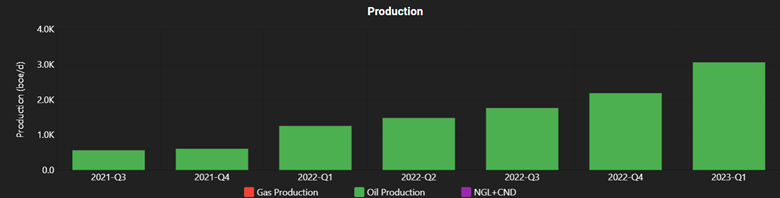
Rubellite Graph Q1 2018 to Q1 2023
| Company Name | Q4 2022 (BOE/d) | Q1 2023 (BOE/d) | Absolute Change (BOE/d) | % Change |
| Saturn | 12,514 | 17,783 | 5,269 | 42.1 |
| Rubellite | 2,181 | 3,057 | 876 | 40.2 |
| Hammerhead | 29,527 | 39,992 | 10,465 | 35.4 |
| Petrus Resources | 9,113 | 11,385 | 2,272 | 24.9 |
| Surge Energy | 22,097 | 25,138 | 3,041 | 13.8 |
| Kelt Exploration | 28,036 | 31,833 | 3,797 | 13.5 |
| Journey | 11,496 | 12,920 | 1,424 | 12.4 |
| Headwater | 15,546 | 17,004 | 1,458 | 9.4 |
| Spartan Delta | 74,639 | 80,200 | 5,561 | 7.5 |
| Yangarra | 11,712 | 12,412 | 700 | 6.0 |
| Tamarack Valley | 64,344 | 67,938 | 3,594 | 5.6 |
| Pieridae | 34,715 | 36,467 | 1,752 | 5.0 |
| Advantage Energy | 55,573 | 58,144 | 2,571 | 4.6 |
| Obsidian Energy | 31,742 | 33,153 | 1,411 | 4.4 |
| Pipestone | 33,816 | 35,162 | 1,346 | 4.0 |
| Crescent Point | 134,124 | 139,280 | 5,156 | 3.8 |
| Gear Energy | 5,755 | 5,952 | 197 | 3.4 |
| Tourmaline | 511,590 | 525,916 | 14,326 | 2.8 |
| Lucero | 11,009 | 11,259 | 250 | 2.3 |
| Cardinal Energy | 21,281 | 21,726 | 445 | 2.1 |
| Canadian Natural Resources | 1,294,679 | 1,319,391 | 24,712 | 1.9 |
| Bonterra Energy | 13,407 | 13,464 | 57 | 0.4 |
| Crew Energy | 32,893 | 32,963 | 70 | 0.2 |
| Paramount | 97,370 | 97,269 | -101 | -0.1 |
| Baytex | 86,864 | 86,760 | -104 | -0.1 |
| Peyto | 104,944 | 102,918 | -2,026 | -1.9 |
| Ovintiv | 523,600 | 511,400 | -12,200 | -2.3 |
| Suncor | 763 | 742 | -21 | -2.8 |
| Kiwetinohk | 24,745 | 23,996 | -749 | -3.0 |
| Athabasca | 35,850 | 34,683 | -1,167 | -3.3 |
| Cenovus | 806,900 | 779,000 | -27,900 | -3.5 |
| Vermilion | 85,450 | 82,455 | -2,995 | -3.5 |
| MEG Energy | 110,805 | 106,840 | -3,965 | -3.6 |
| NuVista | 74,252 | 71,209 | -3,043 | -4.1 |
| Pine Cliff | 21,041 | 20,076 | -965 | -4.6 |
| ARC Resources | 359,730 | 338,377 | -21,353 | -5.9 |
| InPlay Oil | 9,623 | 9,020 | -603 | -6.3 |
| Imperial | 441,000 | 413,000 | -28,000 | -6.3 |
| Birchcliff | 79,799 | 74,592 | -5,207 | -6.5 |
| Perpetual | 7,138 | 6,655 | -483 | -6.8 |
| Whitecap | 166,392 | 155,124 | -11,268 | -6.8 |
| Enerplus | 106,915 | 97,652 | -9,263 | -8.7 |
| TOTAL | 5,604,970 | 5,564,307 | -40,663 | -0.7 |
| AVERAGE | 133,452 | 132,484 | -968 | -0.7 |
Net Debt
Unlike many of the other metrics we’ve discussed, changes in net debt come don’t necessarily come with positive or negative connotations. Instead, changes in debt levels are a potential clue regarding what companies are looking to achieve now and in the future. A number of smaller players saw debt increase in Q1 2023; both Gear Energy and Saturn Energy saw their net debt grow by over 100% this quarter, and 3 more companies saw net debt rise by over 50%. Gear Energy’s debt growth is less significant than the percentage change would lead you to believe, as the company’s $15.3 million net debt load is only around 5% of total enterprise value. Saturn’s net debt growth was predominantly related to its Ridgeback acquisition in January 2023. The company has subsequently announced its intention to direct 60% of cash flow to debt repayment. Advantage Energy’s additional debt situates the company within its target range, as Advantage saw quarterly capital expenditures that were its largest since 2018.
On the flipside, 16 companies reduced their net debt balances in Q1. With respect to proportional reductions, Paramount and Kelt Exploration transitioned from net debt to net cash surplus positions in Q1 2023. With respect to absolute debt volume reductions, Paramount’s shedding of over $200 million in net debt between Q4 2022 and Q1 2023 placed it just behind Whitecap’s group-leading $442 million reduction. Many companies in our dataset have expressed continued commitment towards reaching reduced debt level targets, so we may see continued debt reductions throughout the year if cash flow reaches sufficient levels in quarters 2 through 4. Enerplus also reduced its debt significantly, paying down over $95 million in debt in Q1 2023 in anticipation of returning 60% of free cash flow to shareholders through 2023.
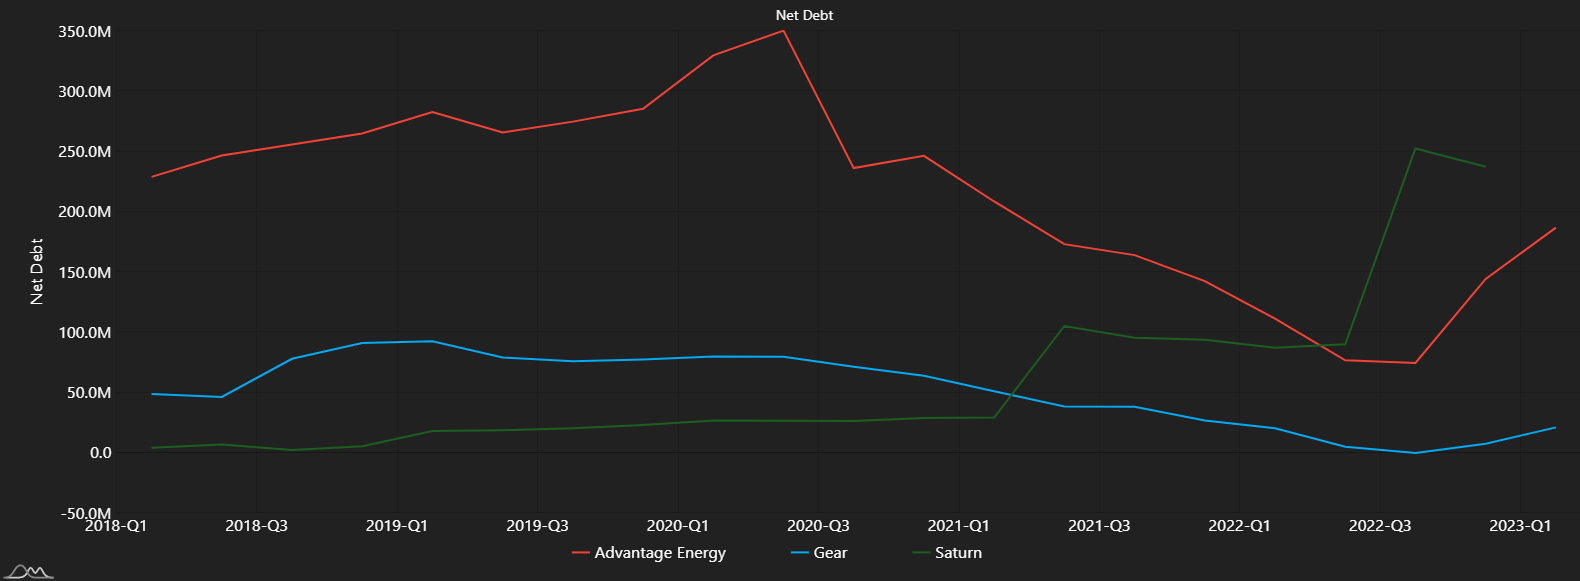
Net Debt History (Q1 2018 to Q1 2023) for Advantage Energy, Gear Energy and Saturn Oil
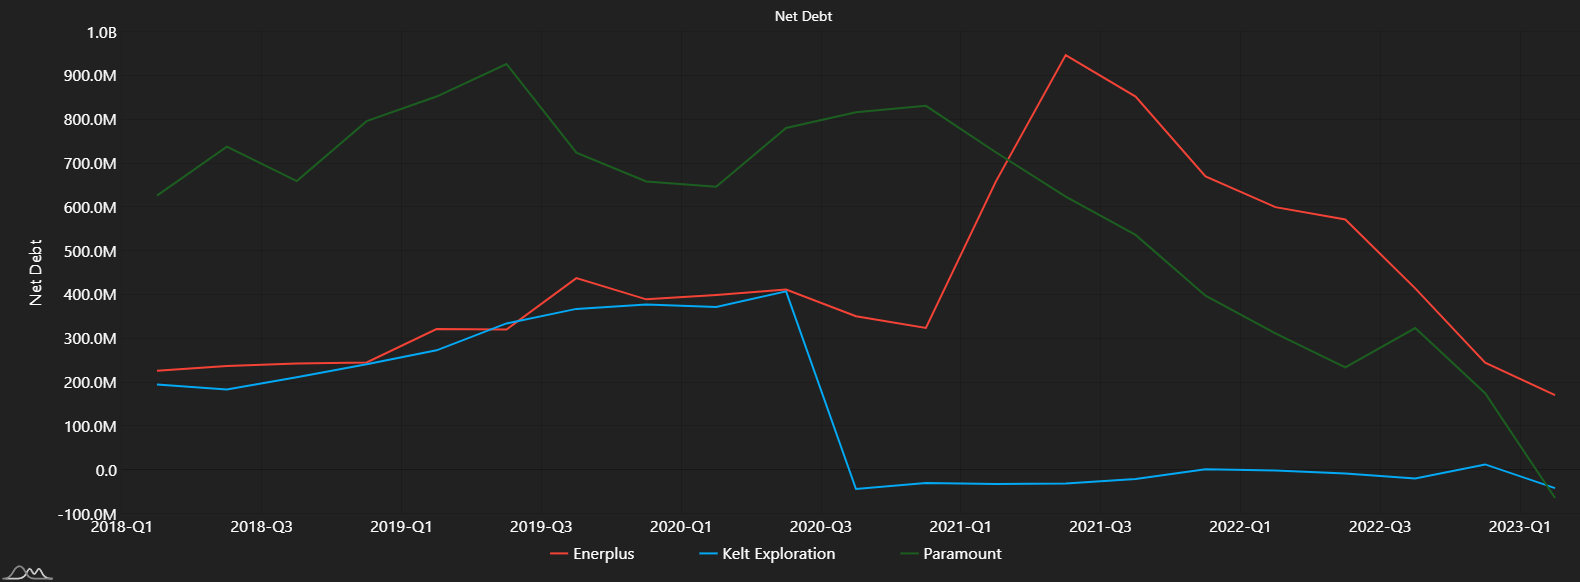
Net Debt History (Q1 2018 to Q1 2023) for Advantage Energy, Kelt Exploration and Paramount Resources
| Company Name | Q4 2022 (Thousand CAD) | Q1 2023 (Thousand CAD) | Absolute Change (Thousand CAD) | % Change |
| Gear Energy | 2,220 | 15,276 | 13,056 | 588.1 |
| Saturn | 219,803 | 556,605 | 336,802 | 153.2 |
| Advantage Energy | 121,336 | 195,523 | 74,187 | 61.1 |
| Birchcliff | 138,549 | 217,927 | 79,378 | 57.3 |
| Cenovus | 4,282,000 | 6,632,000 | 2,350,000 | 54.9 |
| Tourmaline | 494,442 | 709,003 | 214,561 | 43.4 |
| InPlay Oil | 32,963 | 46,204 | 13,241 | 40.2 |
| Hammerhead | 291,647 | 379,755 | 88,108 | 30.2 |
| Kiwetinohk | 122,304 | 157,540 | 35,236 | 28.8 |
| Pipestone | 117,435 | 150,409 | 32,974 | 28.1 |
| Cardinal Energy | 62,672 | 78,033 | 15,361 | 24.5 |
| Crescent Point | 1,154,700 | 1,436,300 | 281,600 | 24.4 |
| Bonterra Energy | 149,831 | 183,674 | 33,843 | 22.6 |
| Suncor | 13,639,000 | 15,714,000 | 2,075,000 | 15.2 |
| Canadian Natural Resources | 10,525,000 | 11,932,000 | 1,407,000 | 13.4 |
| Obsidian Energy | 316,800 | 351,400 | 34,600 | 10.9 |
| Petrus Resources | 50,808 | 53,111 | 2,303 | 4.5 |
| Pine Cliff | -55,913 | -58,139 | -2,226 | 4.0 |
| Vermilion | 1,344,586 | 1,368,029 | 23,443 | 1.7 |
| Tamarack Valley | 1,356,570 | 1,374,068 | 17,498 | 1.3 |
| Baytex | 987,446 | 995,170 | 7,724 | 0.8 |
| Spartan Delta | 138,376 | 138,706 | 330 | 0.2 |
| MEG Energy | 1,389,000 | 1,381,000 | -8,000 | -0.6 |
| Peyto | 885,137 | 877,827 | -7,310 | -0.8 |
| Perpetual | 56,349 | 55,429 | -920 | -1.6 |
| NuVista | 171,805 | 168,985 | -2,820 | -1.6 |
| ARC Resources | 1,301,500 | 1,264,700 | -36,800 | -2.8 |
| Pieridae | 214,503 | 202,180 | -12,323 | -5.7 |
| Surge Energy | 352,213 | 331,917 | -20,296 | -5.8 |
| Yangarra | 134,364 | 121,529 | -12,835 | -9.6 |
| Lucero | 77,426 | 69,608 | -7,818 | -10.1 |
| Whitecap | 1,913,100 | 1,471,100 | -442,000 | -23.1 |
| Rubellite | 28,228 | 20,920 | -7,308 | -25.9 |
| Journey | 98,768 | 71,071 | -27,697 | -28.0 |
| Crew Energy | 149,454 | 105,285 | -44,169 | -29.6 |
| Enerplus | 299,346 | 203,514 | -95,832 | -32.0 |
| Paramount | 161,200 | -43,600 | -204,800 | -127.0 |
| Kelt Exploration | 9,789 | -4,899 | -14,688 | -150.0 |
| Ovintiv* | 0 | 0 | 0 | 0.0 |
| Headwater* | 0 | 0 | 0 | 0.0 |
| Athabasca* | 0 | 0 | 0 | 0.0 |
| Imperial* | 0 | 0 | 0 | 0.0 |
| AVERAGE | 1,124,599 | 1,287,452 | 162,853 | 14.5 |
* These companies do not directly report their net debt levels. As such, we have left them out of this table and they are not included in the average calculations.
Operating Cash Flow
Driven in large part by unfavourable pricing developments, operating cash flow was down for most of the companies in our dataset. In a quarter with declines in both oil and gas prices, producers across the Canadian oilpatch had depressed cash flow in Q1 2023; of the companies in our dataset, 36 did not grow operating cash flow in this quarter. On a more granular level, the average company decline was a substantial 62.7%. Our data suggests that significant proportional cash flow declines among a few large companies were contrasted by more moderate declines for a larger number of smaller producers. With that said, a number of firms achieved impressive cash flow growth despite these challenging conditions. Kelt Exploration led the pack with 57.1% quarter-over-quarter growth. This was fuelled by both 13.5% growth in production as well as improved hedging performance. Hammerhead’s growth was a result of similar dynamics; stronger realized hedging outcomes bolstered cash flow gains from Hammerhead’s 35.4% production growth. Tourmaline strung together its second consecutive quarter of increased cash from operations, driven in part by increased natural gas production that compensated for reduced netbacks. An important caveat for the results posted by Imperial Oil and Cenovus: these companies’ lower operating cash flow results are related to catch-up tax payments. As such, this negative quarter can likely be considered a one-off for these two major producers.
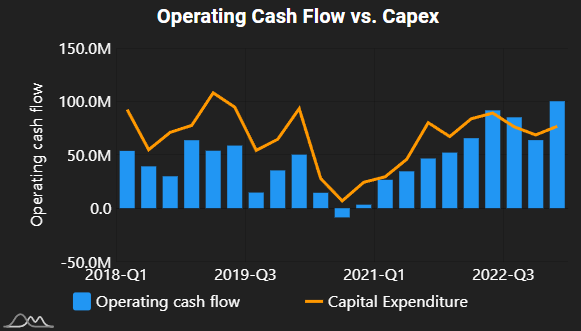
Kelt Exploration Operating Cash Flow and Capital Expenditures Q1 2018 to Q1 2023
| Company Name | Q4 2022 (Thousand CAD) | Q1 2023 (Thousand CAD) | Absolute Change (Thousand CAD) | % Change |
| Kelt Exploration | 63,742 | 100,160 | 36,418 | 57.1 |
| Hammerhead | 76,131 | 115,541 | 39,410 | 51.8 |
| Tourmaline | 1,115,399 | 1,538,075 | 422,676 | 37.9 |
| Spartan Delta | 200,363 | 214,718 | 14,355 | 7.2 |
| Crew Energy | 62,570 | 66,644 | 4,074 | 6.5 |
| Pieridae | 40,134 | 41,309 | 1,175 | 2.9 |
| NuVista | 226,688 | 215,221 | -11,467 | -5.1 |
| Advantage Energy | 112,558 | 105,955 | -6,603 | -5.9 |
| Kiwetinohk | 87,023 | 80,160 | -6,863 | -7.9 |
| Peyto | 199,943 | 183,606 | -16,337 | -8.2 |
| Headwater | 66,448 | 60,201 | -6,247 | -9.4 |
| Ovintiv | 1,188,250 | 1,068,000 | -120,250 | -10.1 |
| Paramount | 306,900 | 271,400 | -35,500 | -11.6 |
| Perpetual | 8,749 | 7,436 | -1,313 | -15.0 |
| Whitecap | 555,800 | 468,600 | -87,200 | -15.7 |
| Yangarra | 40,676 | 33,948 | -6,728 | -16.5 |
| Lucero | 41,903 | 34,918 | -6,985 | -16.7 |
| Pipestone | 96,119 | 78,000 | -18,119 | -18.9 |
| Saturn | 58,100 | 46,794 | -11,306 | -19.5 |
| Gear Energy | 18,565 | 14,933 | -3,632 | -19.6 |
| Crescent Point | 589,500 | 473,400 | -116,100 | -19.7 |
| Vermilion | 495,195 | 388,629 | -106,566 | -21.5 |
| Enerplus | 427,816 | 326,216 | -101,600 | -23.7 |
| InPlay Oil | 29,527 | 22,224 | -7,303 | -24.7 |
| Surge Energy | 78,975 | 54,506 | -24,469 | -31.0 |
| Bonterra Energy | 35,494 | 24,018 | -11,476 | -32.3 |
| Pine Cliff | 33,791 | 22,326 | -11,465 | -33.9 |
| Rubellite | 14,950 | 9,285 | -5,665 | -37.9 |
| ARC Resources | 878,300 | 540,300 | -338,000 | -38.5 |
| Baytex | 303,441 | 184,938 | -118,503 | -39.1 |
| Cardinal Energy | 68,685 | 41,089 | -27,596 | -40.2 |
| Obsidian Energy | 126,500 | 72,600 | -53,900 | -42.6 |
| Birchcliff | 224,447 | 111,330 | -113,117 | -50.4 |
| Journey | 25,346 | 11,461 | -13,885 | -54.8 |
| MEG Energy | 526,000 | 237,000 | -289,000 | -54.9 |
| Petrus Resources | 31,220 | 13,287 | -17,933 | -57.4 |
| Athabasca | 69,368 | 20,537 | -48,831 | -70.4 |
| Canadian Natural Resources | 4,544,000 | 1,295,000 | -3,249,000 | -71.5 |
| Suncor | 3,924,000 | 1,039,000 | -2,885,000 | -73.5 |
| Tamarack Valley | 227,889 | 59,624 | -168,265 | -73.8 |
| Cenovus | 2,970,000 | -286,000 | -3,256,000 | -109.6 |
| Imperial | 2,797,000 | -821,000 | -3,618,000 | -129.4 |
| AVERAGE | 547,322 | 204,414 | -342,908 | -62.7 |
In Part 2, we will break down per barrel cost/revenue metric performance. This analysis was made possible with BOE Intel. For more information or to set up a demo, please contact us.