
Each week, XI Technologies uncovers trends and insights using our enhanced data and software focused on the WCSB. If you’d like Word to the Wise delivered directly to your inbox, subscribe here.
After a slower summer, late August and September are heating up for M&A deals. On September 6th, 2023, Peyto Exploration and Development Corp (“Peyto”) announced its partnership interest purchase agreement to acquire Repsol Canada Energy Partnership (“Repsol”) for US $468 million.
When assessing this transaction through different lenses using AssetSuite software tools, we looked at each company’s asset profile, plus the combined entity to gain valuable insight into the transaction.
On a relative basis, while Repsol contributes 21% of the production to the combined entity, it contributes a higher percentage of reserves at 32%. On a land basis, it contributes a comparable percentage to developed and undeveloped land, relatively close to half of the combined entity, suggesting land opportunities. On a license basis, relative to the production share, Repsol contributes a disproportionately high percentage of inactive licenses at 63%, indicating that Peyto has acquired some additional abandonment liability with this acquisition.
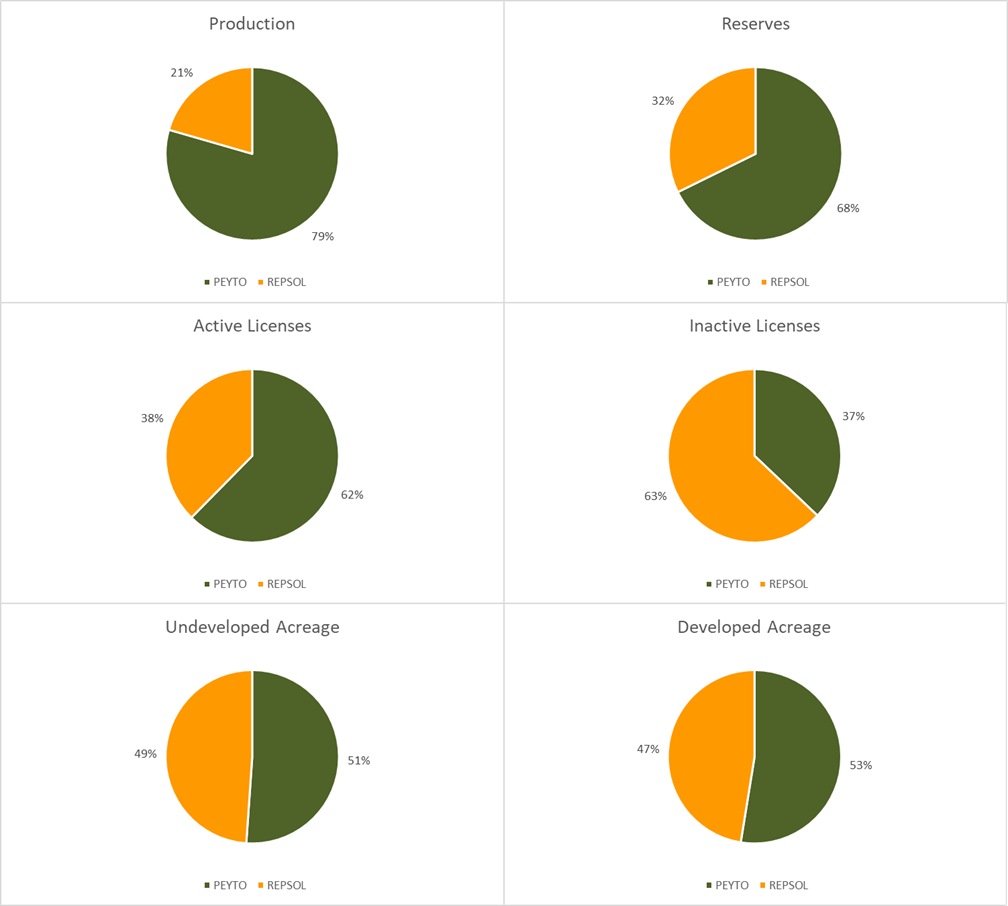
Figure 1 – Working Interest values for Repsol (orange) and Peyto (green)
While the absolute numbers tell one story, accretion and dilution metrics can tell us more. Looking at the AssetSuite summary, we can calculate some accretion and dilution metrics for this transaction relative to the increase in production.
While Peyto’s production base grew by 26%, operatorship and BOE working interest decreased by 6% and 5% respectively. The undeveloped land ratio (undeveloped land in hectares divided by the production), increased by 56%, indicating potential exploitation opportunities.

As indicated above, the high contribution of inactive licenses was accretive to Petyo’s asset base, which is a resulting negative indicator.
Average well productivity dropped by 17% from 52 boe/d to 43 boe/d. The decline rate of the Repsol asset base is 14% compared to Peyto’s 32%, which is a positive indicator and reflective of the comparative drilling activity of these two companies over the past three years. Peyto has drilled 208 wells in the past three years compared to Repsol’s 9 wells, which could explain the higher decline rate as flush production from newer wells comes on-stream. Repsol’s large reserve base relative to production is also accretive to the pro-forma Reserve Life Index (RLI), increasing by 17%.

Many of these indicators; low, stable decline on long-life assets, high undeveloped land ratio and very little development in the past three years, point to an asset base that has been underexploited.
While essentially all of Repsol’s producing assets are synergistic to Petyo’s Deep Basin assets, there are a large number of other non-producing wells and facilities scattered throughout the Western Canadian Sedimentary Basin (WCSB). Let us first explore the core deal and then discuss the liabilities.
CORE AREA
The core of this deal is the Deep Basin, a combination of XI’s Grande Prairie and Central Alberta Regions, encompassing 99% of the combined entity production. These prolific regions account for approximately 28%, or 1.7 mmboe/day of production, for Alberta.
The main targets in this area range from the Cardium down to the Lower Manville and encompass the Spirit River Formation, however, the stacked Cretaceous horizons and high rate of commingled production in the area make isolating production by zone difficult.

Figure 2 – Zone analysis of Core Area
Looking at a map of the well assets over the Deep Basin area, the synergies between the Repsol and Peyto assets are obvious.
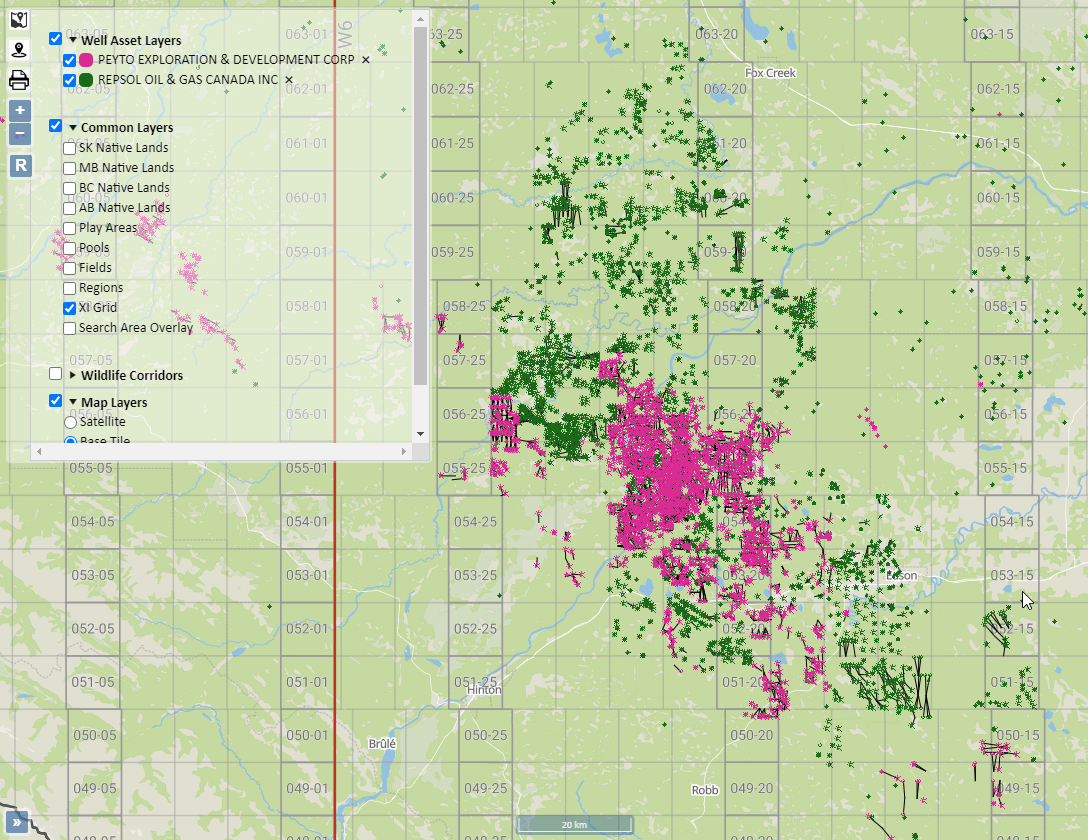
Figure 3 – Peyto and Repsol in Core Area
Looking at the focus of this transaction, 70% of Peyto’s total BOE/day and effectively 100% of Repsol’s total BOE/day is within the Deep Basin. Both companies are heavily gas-weighted with complimentary infrastructure well positioned for operational synergies.
Looking at all players in the Deep Basin area on the map below, Tourmaline Oil Corporation controls 25% of area production, with approximately 99,000 boe/day. A larger and diverse company, this accounts for approximately 22% of Tourmaline’s total production. Peyto holds the second largest stake in this area with approximately 60,280 boe/day or 15.3% of the area and accounts for 70% of company production. Repsol sits at number four on the list with 22,108 boe/day as identified by AssetBook. As licensee (or operator) on approximately 71% of this production, traditional searches using public data from other products would potentially underestimate production by not accounting for non-operated assets. Eighty companies have ten or more boe/day of production in this area.
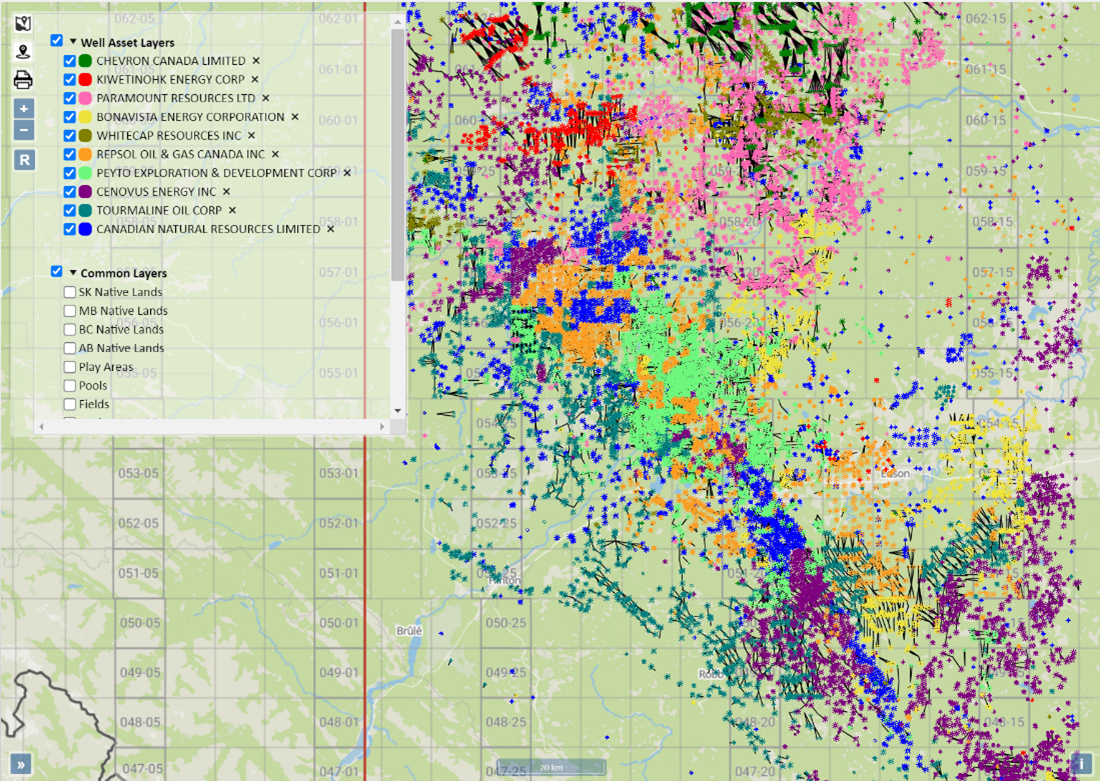
Figure 4 – Top 10 companies in Core Area
Liability Overview
Liability is where this transaction gets interesting. As Repsol expanded in Canada through various acquisitions, ending with their Talisman acquisition in 2014, the company acquired non-producing wells and facilities scattered throughout the WCSB.

Figure 5 – Map of Repsol across WCSB
Many of these non-producing assets are still under the original Company Operator (BA) codes with the various governments and regulators. The subsidiary list below shows all the currently active Government Company Codes that can be attributed to Repsol:

Figure 6 – XI’s subsidiary list for Repsol
Using an LLR analysis, Peyto is in a strong position to absorb these liabilities. Based on original LLR calculations and current public government information, this deal moves Peyto from an 8.79 LLR score to a 6.50 score, which, while dilutive, still leaves Peyto in a strong position. According to AssetBook’s LLR Module (which only accounts for licensed assets), Peyto will absorb net $174,952,728 in deemed liabilities across Saskatchewan, Alberta, and British Columbia.
Figure 7 – LLR Analysis for Repsol
However, knowing Repsol only operates 71% of its assets, it is important to look at all liabilities from a working interest perspective. Of the total well count of 1138 net wells, 16% of wells are inactive, and 14% are abandoned.
Using XI’s industry-standard cost model, the liability is closer to $228,380,867 undiscounted.
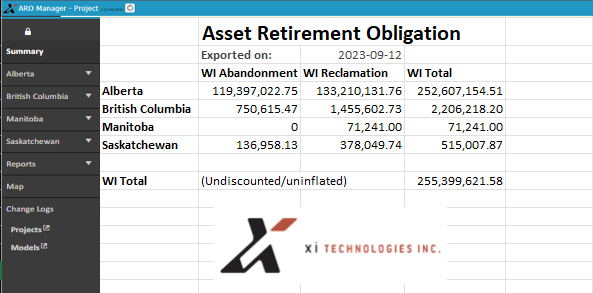
Figure 8 – ARO Analysis for Repsol
While analyzing deals after they are announced is interesting, our tools provide the leg up required to look at your own deals or find deals to create better value. For more results, contact XI Technologies to learn more about how XI’s AssetSuite software can analyze potential mergers, acquisitions, and opportunities, including examining potential liabilities and emissions.
Not long before this transaction was announced, XI was asked to do a case study comparing AssetBook to other traditional tools for assessing a specific acquisition opportunity, looking at both workflow and results. Interestingly, Repsol was our test case. In a side-by-side comparison, AssetBook produced the same results (in a fraction of the time) as those announced in the press release for this transaction. To review the complete case study, download A&D Workflow case study here.
To view and download the Company Report: Click here
To view and download an All Areas Report: Click here
Discover how XI’s ARO Manager can help with the planning and reporting of liability management. Visit XI’s website or contact XI for a demo.
Join us for our upcoming webinars:
The Fundamentals of ARO Manager for Financial Tracking and Reporting to learn how you can make your life easier with the first and only software application designed for estimating and monitoring ARO in WCSB, on September 14 at 9AM. Register here
AssetBook 101 to help you identify potential new clients and opportunities for acquisitions, divestitures, mergers, trades, and farm-in potential, on October 03 at 10 AM. Register here