In the last month, MEG Energy released its Q3 report, and followed it up with its 2024 capital guidance and operational plan. For 2024, the company has guided to $550 MM of capital expenditures, which is up $100 MM year over year. This increase seemed to be largely expected, as the company has been flagging extra growth capital as it builds towards future capacity growth of 15,000 bbl/d at Christina Lake. MEG estimates this additional growth capital to be $300 MM over the 2024-2026 period.
MEG has also guided to USD $600 MM of net debt as its threshold to begin returning 100% of free cash flow to shareholders. The company expects to reach this target sometime around Q3 2024.
Which brings us to three fascinating charts from the company’s BOE Intel profile.
BOE Intel subscribers can click here to go straight to MEG’s BOE Intel profile to see more charts and data. Others can email us here to inquire about setting up a BOE Intel demo for your company so that you can gain access.
Figure 1 – MEG net debt relative to corporate production
While the improvement in the company’s financial health is well known, it’s still a very impressive chart. MEG has seen net debt levels fall by more than CDN $2.3 billion since Q1 2019. Note that MEG’s net debt targets are in $USD relative to its reporting (and this chart) in $CDN.
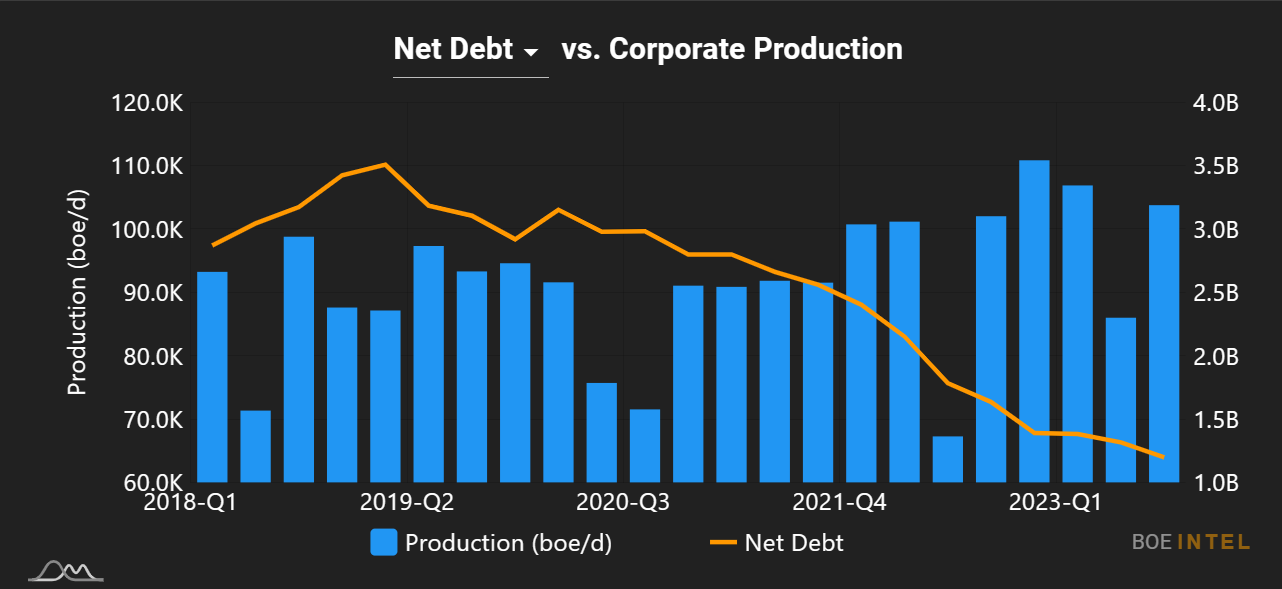
Figure 2 – MEG operating cash flow vs. capex (the free cash flow chart)
The company has been able to repay so much debt as a result of the chart below, the free cash flow chart. Operating cash flow has exceeded capex now for 10 consecutive quarters.
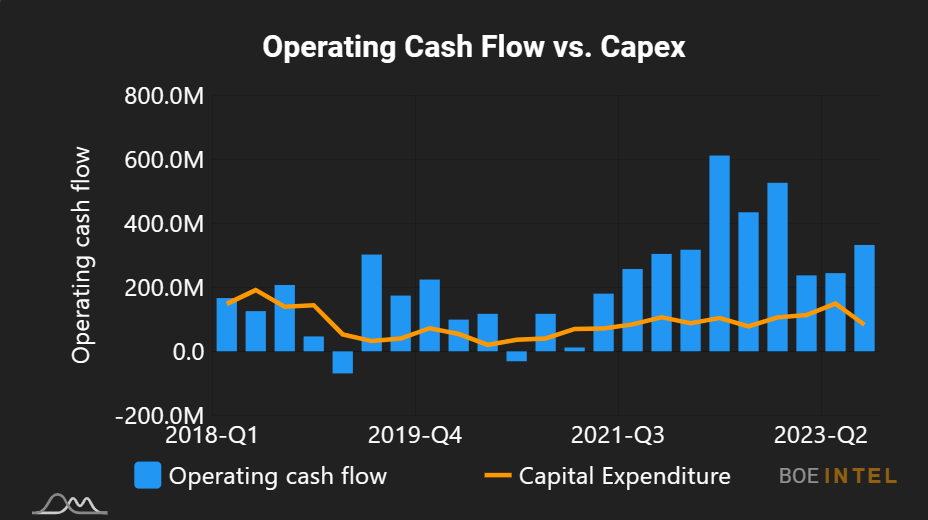
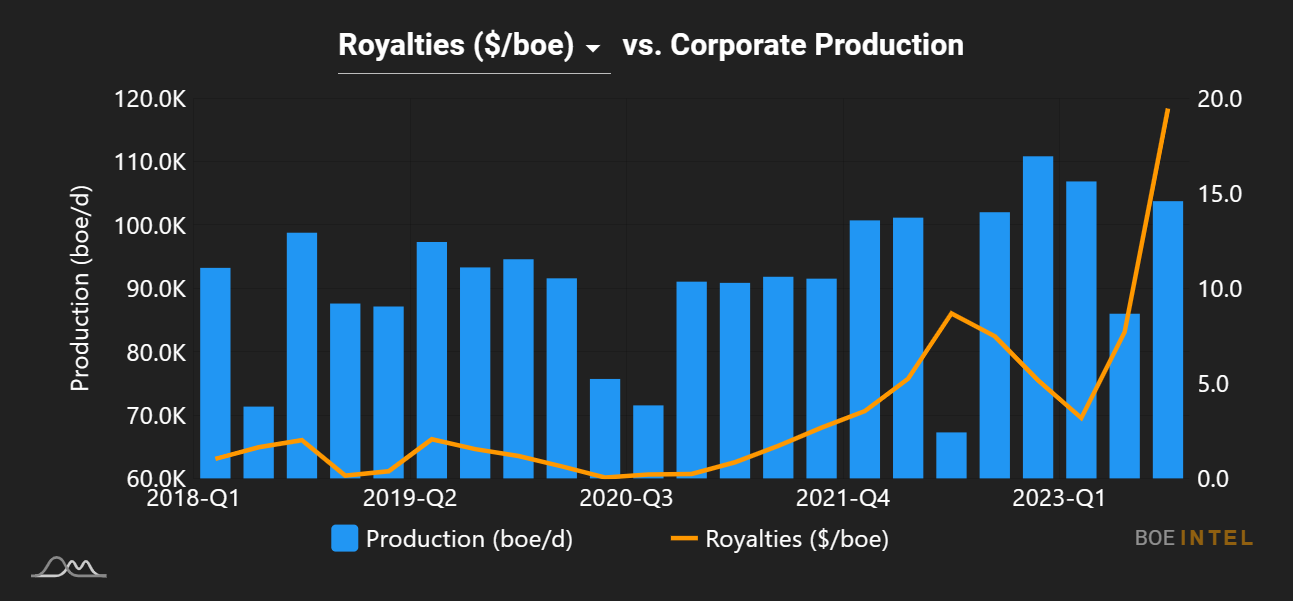
Figure 3 – MEG royalties expense
At some point during Q2 2023, MEG reached post-payout status which has resulted in a jump in the royalty rate that the company pays. For Q3 2023, an increase in oil prices combined with that post-payout status meant that the company paid $19.45/BOE in royalties, a sharp increase from its pre-payout levels.