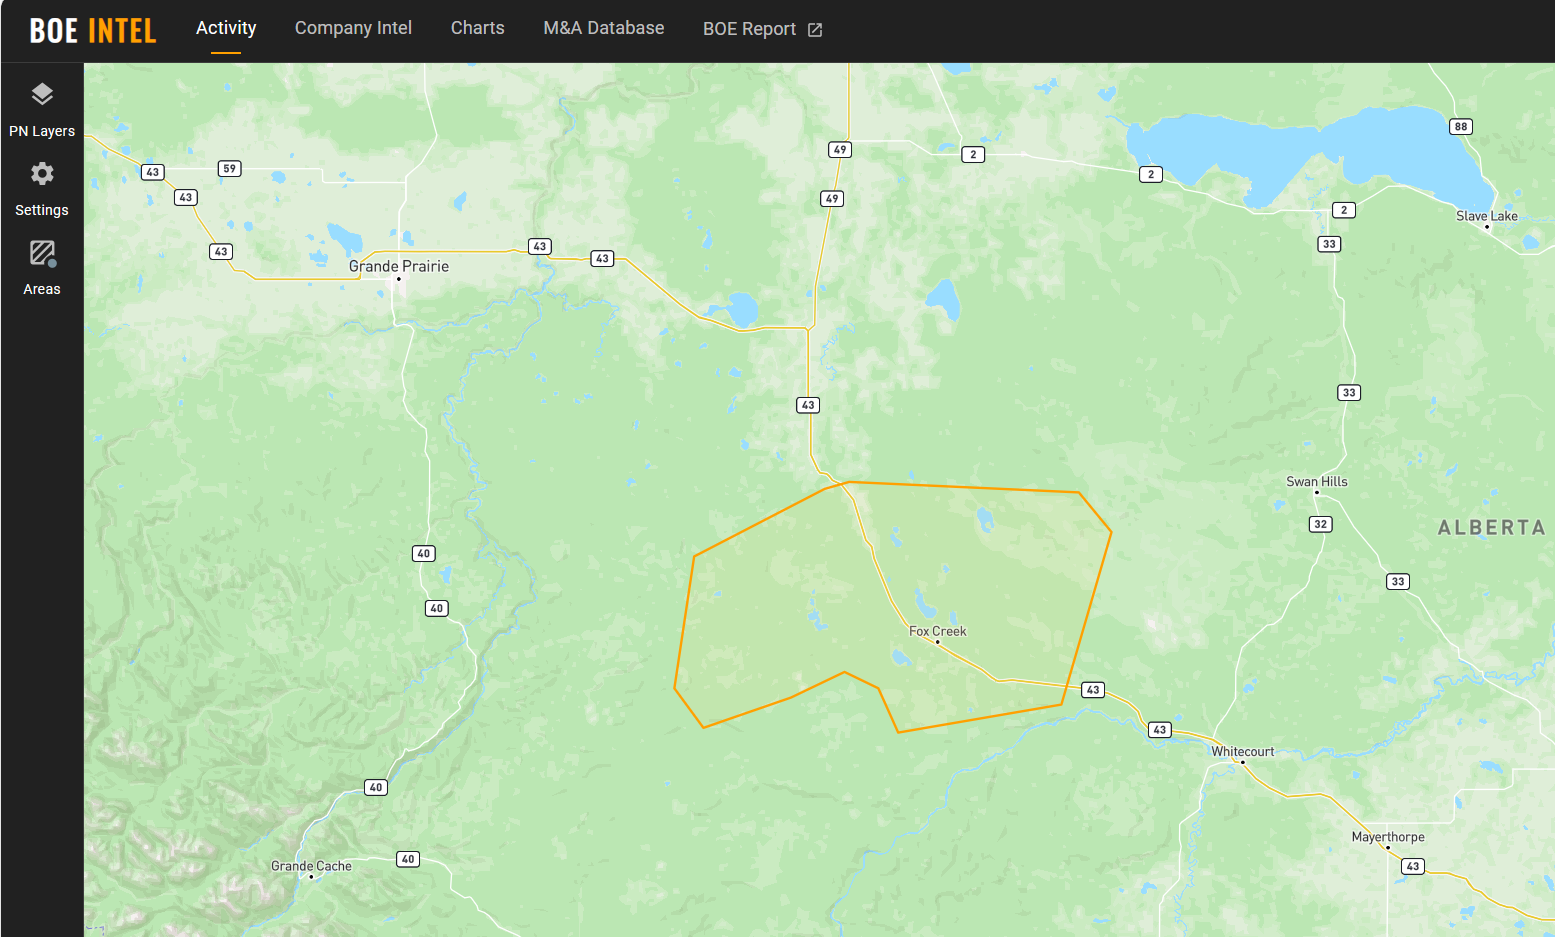
For this analysis, we have used BOE Intel’s “define an area” feature to see changes in activity levels in a given area. We’ve drawn a polygon around the Kaybob area largely defined by where the Duvernay spuds and licences have been over the last few years.
The area that we have focused on is shown in the map below in Figure 1.
To inquire about a BOE Intel subscription for your company, contact us here.
Figure 1 – Kaybob area polygon
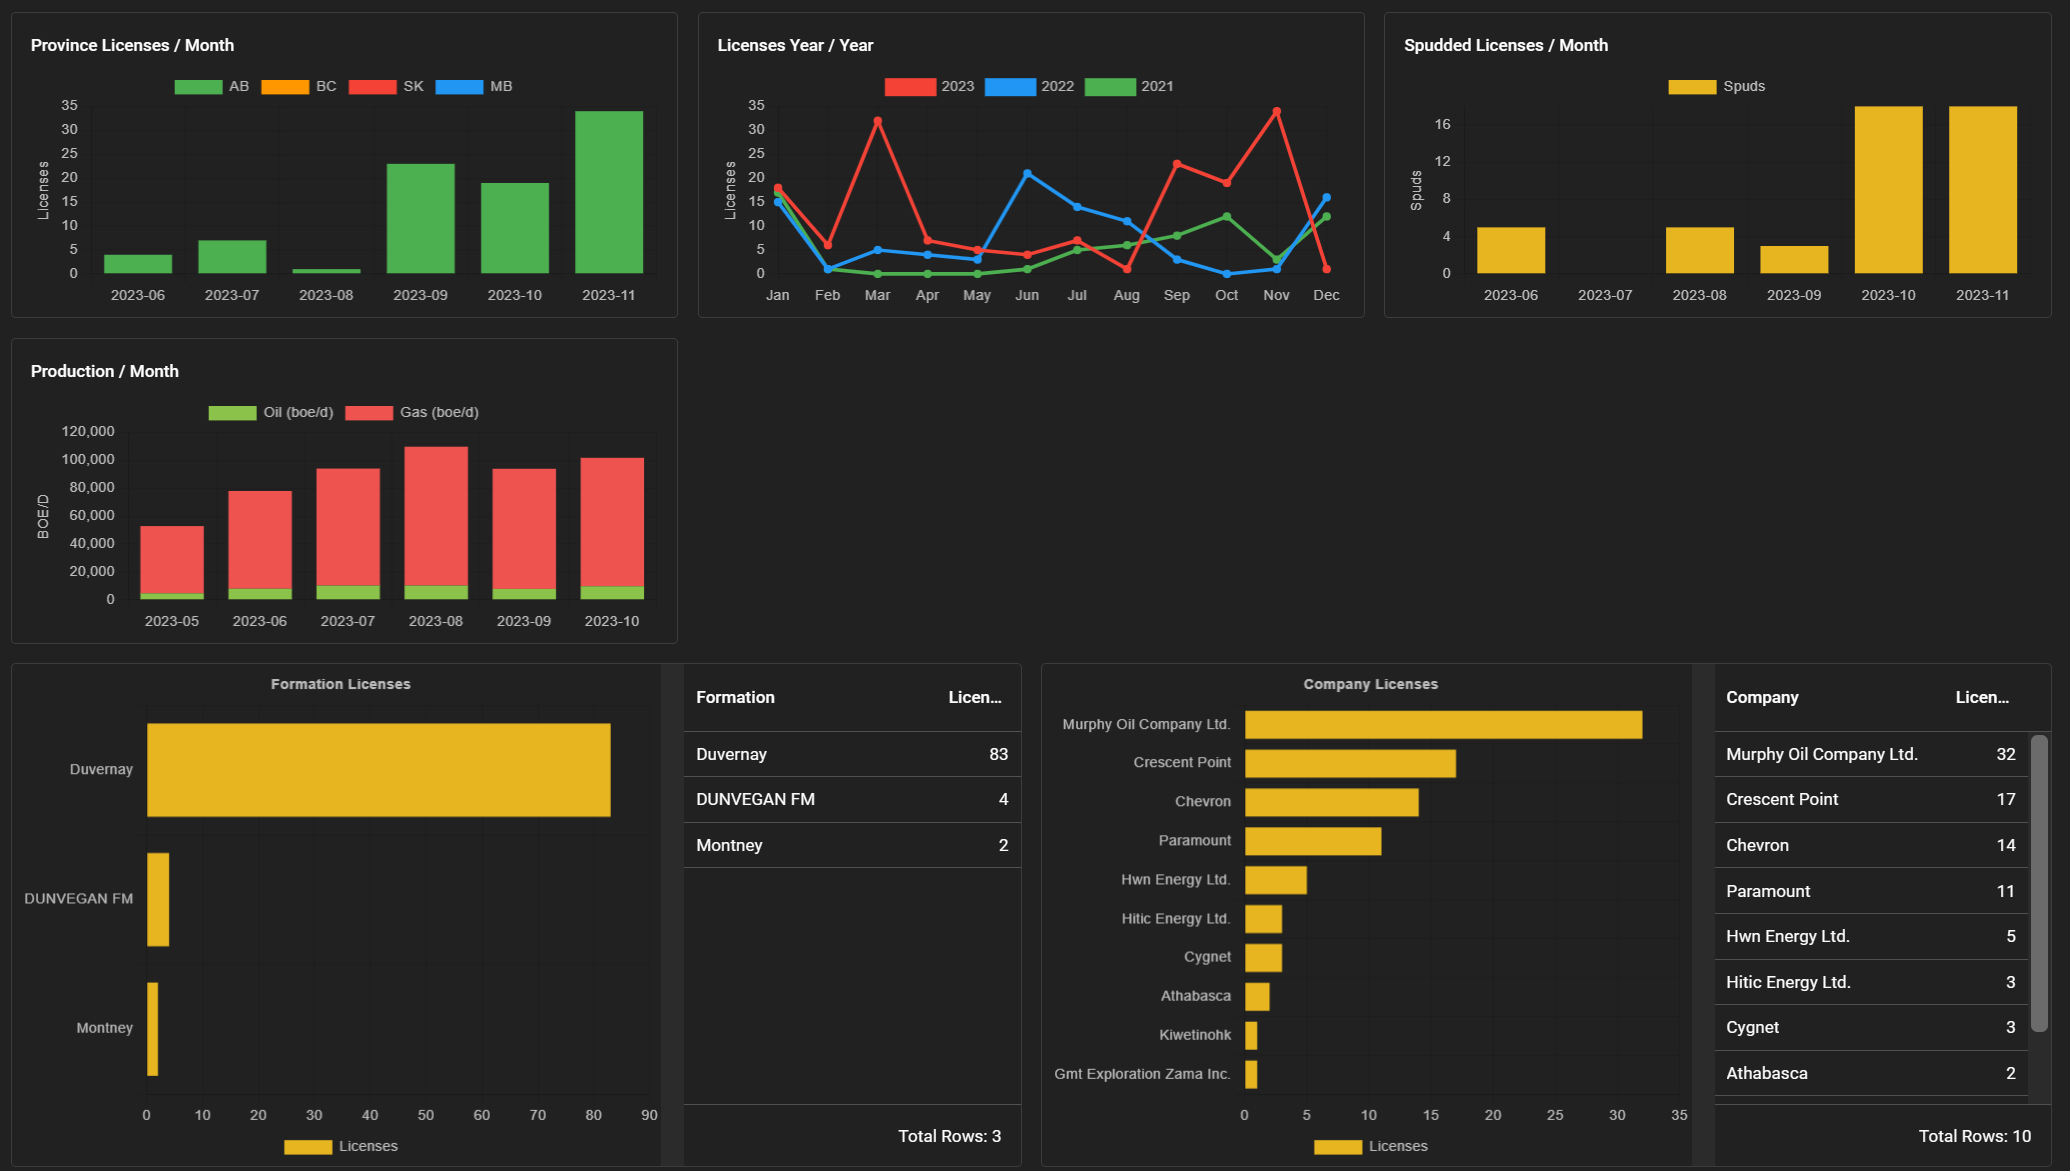
Using that area we can create a report (Figure 2 – partial view of an activity report from BOE Intel) to see changes in activity levels over various timeframes. Here we can see that over the last 6 months, activity in the Kaybob area appears to be accelerating. Licensing activity really began to pick up in September of this year, largely driven by Murphy Oil with 32 licences, although also includes strong licensing activity from Crescent Point (17 licences), Chevron (14 licences), Paramount Resources (11 licences) and several others as well. The vast majority of licences in this area over the last six months (83 out of 89) are targeting the Duvernay. Year over year the licensing changes are evident as well, going from 65 in 2021, to 94 last year, to 157 in 2023 so far.
While the licensing activity is a strong indicator of future activity, we can also see that spuds began to pick up in October of this year. After only 13 spuds over a 4 month period from June to September of this year, we saw 36 total spuds in October and November, driven by Crescent Point, Chevron, and Paramount. Of the 46 spuds that we have seen in this area over the last 6 months, 39 of them targeted the Duvernay.
Also shown in this report is the production by area. We can see October 2023 production averaged ~102,000 BOE/d in the area we have drawn on the map, up from a severely impacted (due to wildfires) production rate of ~53,000 BOE/d in May. Note that October production levels are still down slightly from the pre-wildfire April production levels. Also, due to single stream reporting in Alberta, NGL and condensate volumes are not shown here, but get stripped out of the natural gas volumes.
Figure 2 – BOE Intel – Kaybob area activity report
What exactly is driving the increased Duvernay activity is not quite clear at this point, although we have anecdotally noticed an increase in Duvernay wells popping up on our top well reports. This month’s TOP WELL REPORT featured 4 Duvernay wells out of the top 15 oil/condensate wells in Canada.
It appears that operators continue to try and find the optimal well design for Duvernay wells in the area as shown in the chart below (Figure 5) with data from Petro Ninja. This is a broad cross section of Kaybob area Duvernay wells by average lateral length. What is obvious is that operators are drilling longer than ever in the Duvernay as drilling technology gets better and better.
Figure 5 – Average lateral length for Duvernay spuds near Kaybob area
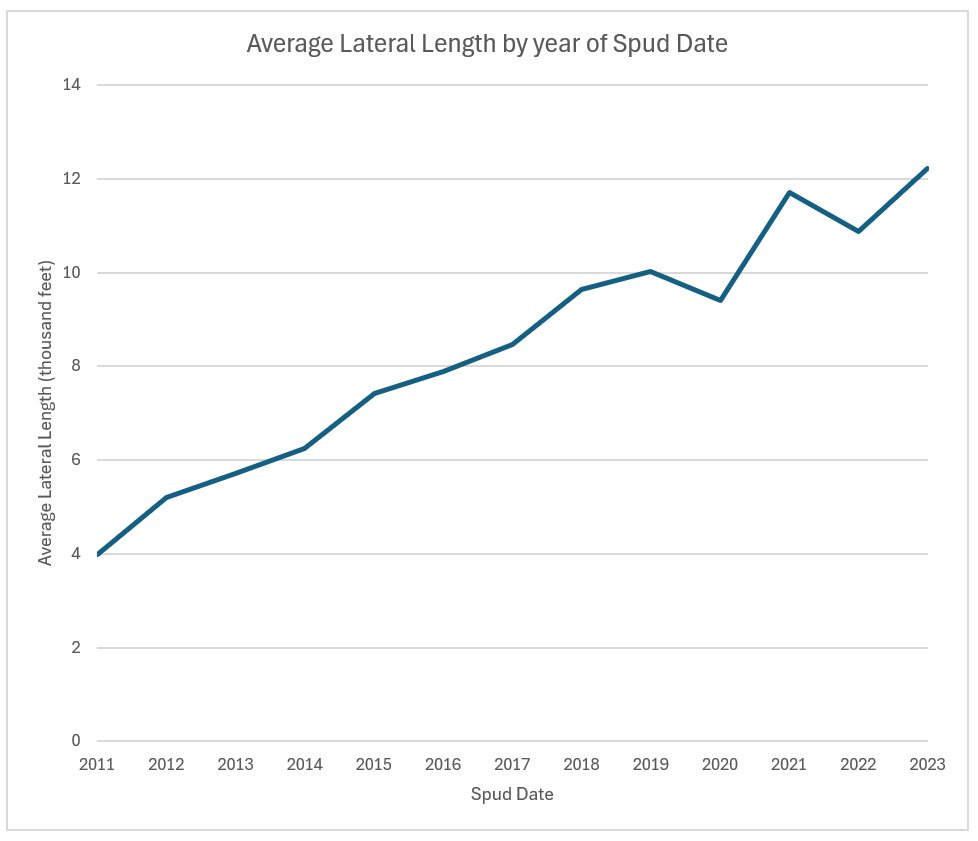
*data sourced from Petro Ninja
Perhaps improved drilling technology and longer laterals are helping to unlock the Duvernay resource more efficiently than before. A look at the average IP90 (initial production for the first 90 days on production) shows an increasing trend for this group of Duvernay wells surrounding Kaybob. 2022 appeared to mark a step change in the play with the highest IP rates yet (Figure 6). We decided to leave out data from 2023 spuds as there are only a limited number of wells spud in 2023 with 90 days of production history, but what wells we do have data for at this moment suggests 2023 vintage wells may have higher IP rates than 2022.
Given the increased activity surrounding Kaybob and in the Duvernay in particular, it stand out as an area to watch in 2024.
Figure 6 – Average initial production rates over first 90 days on production – Kaybob area Duvernay wells
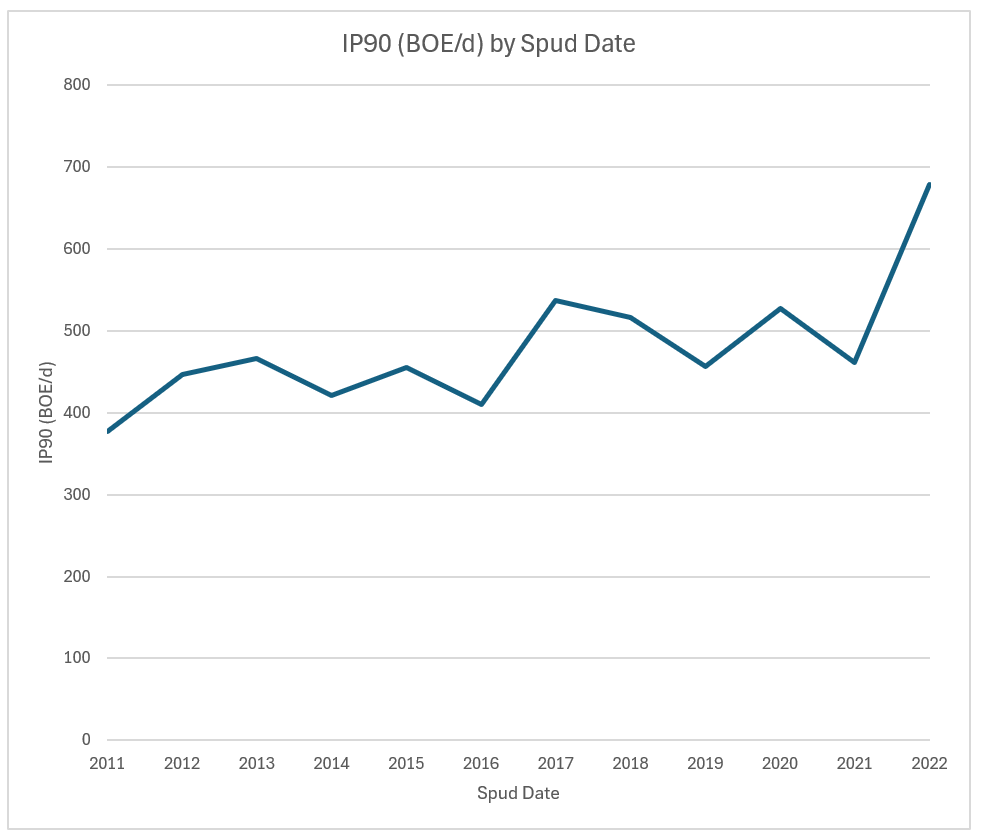
*data sourced from Petro Ninja