With a majority of Canadian producers having now announced their year end results, it’s time for another BOE Intel Earnings Season Report Card. As usual, part 1 will focus on production and financial metrics, while part 2 will cover per-barrel metrics.
Overall, Q4 was a bounce back quarter for many producers. Production of both liquids and natural gas were up in aggregate, with companies largely delivering on ambitious 2023 capital budgets. It was also a good quarter from a financial standpoint, with the average producer increasing its operating cash flow on account of both increased output as well as an improved commodity pricing environment for natural gas-weighted companies. This good cash flow news wasn’t restricted to natural gas specialists, however, as the quarter was productive for producers across commodity mixes. And where there are E&Ps generating cash, you can bet that there will be changes in net debt. While the average company saw a slight net debt decline, many other companies took on high debt volumes to finance acquisitions and capital programs. For the full story on these key indicators of oil patch success, keep reading.
Natural Gas Production
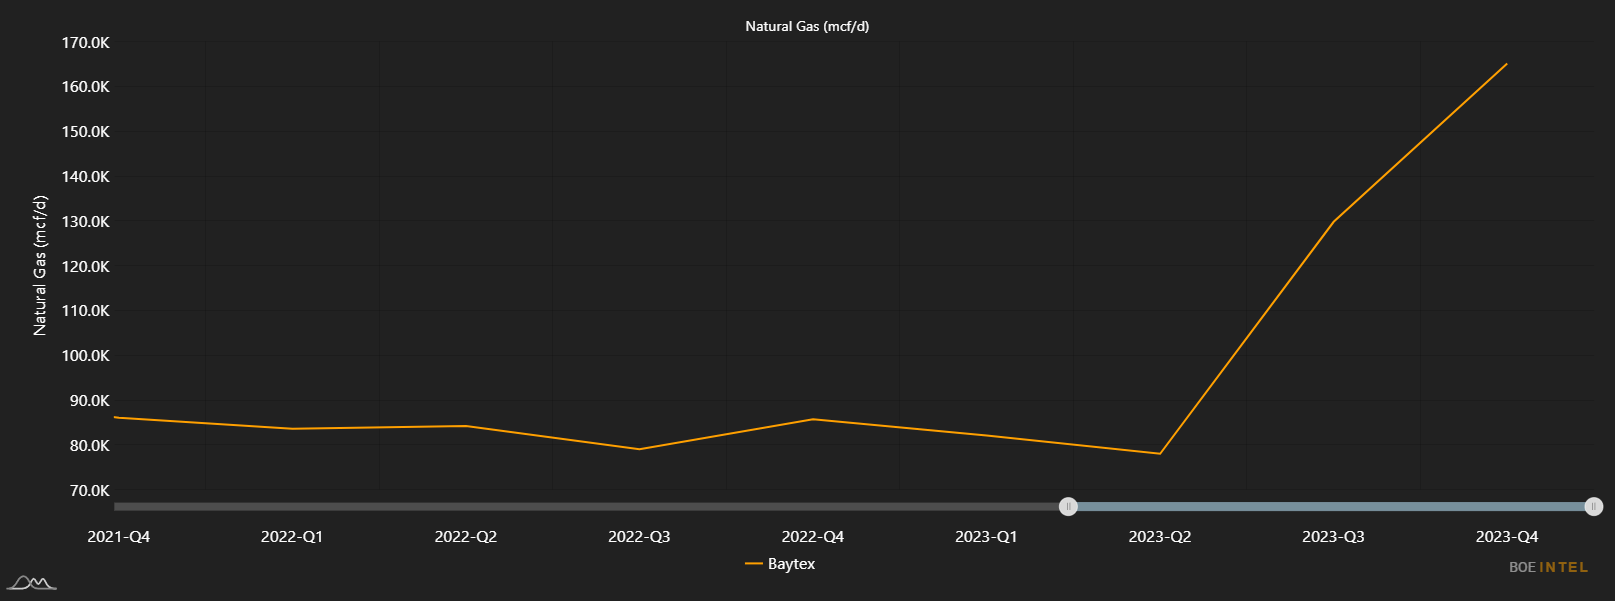
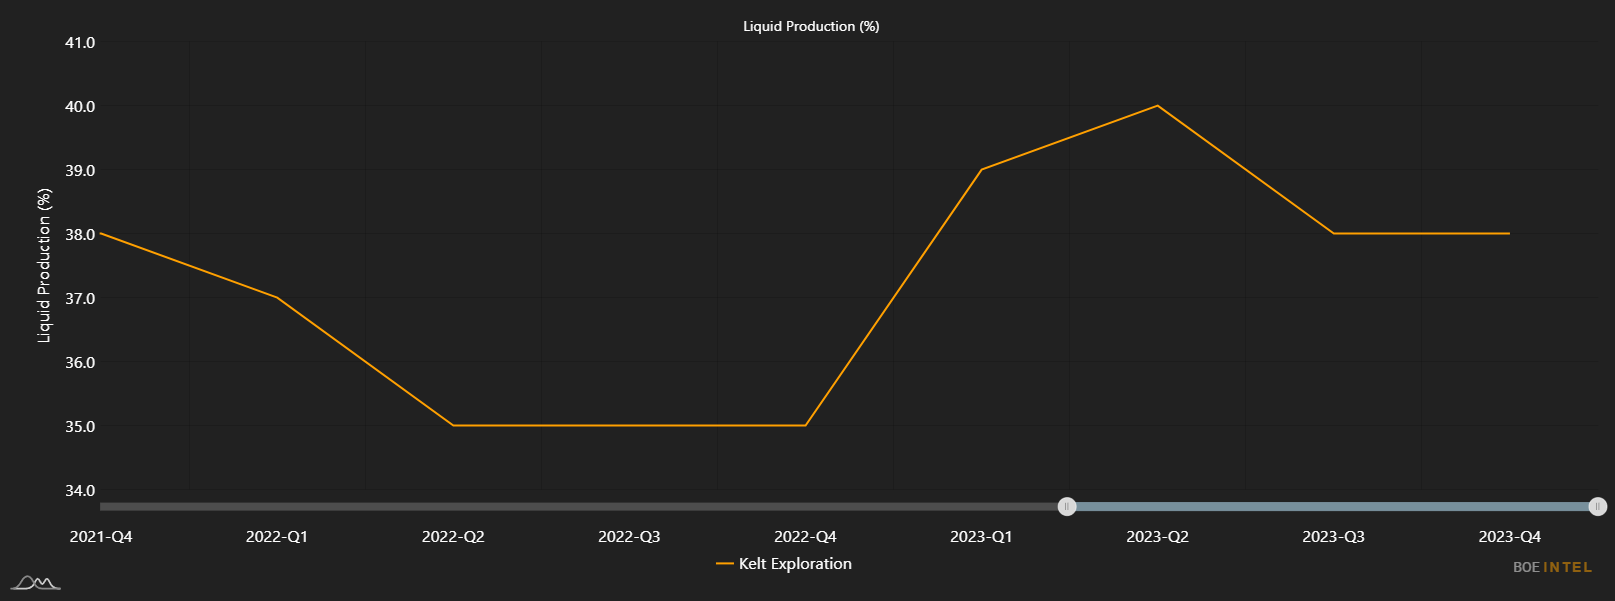
Natural gas production was up in Q4, with the average company increasing its production by 5% compared to the prior quarter. The strongest performance with respect to percentage change was Headwater, which increased its natural gas production from 6.1 mmcf/d to 8.0 mmcf/d (31.1%). Predominantly an oil producer, Headwater’s proportional improvement is largely due to its low gas production baseline as well as some seasonal gas production that it tends to turn on and off as the winter months come and go. With that said, it’s unsurprising to see the company produce more gas; they’re producing more of everything as the quarters go by. Baytex Energy, on the other hand, attained similar proportional growth from a much higher Q3 level. This 27.2% jump was driven by a noteworthy production increase from its US assets: Baytex’s natural gas production south of the border grew from 79.7 mmcf/d to 116.6 mmcf/d. And despite drilling “oilier wells in the Montney and Charlie Lake plays in 2023“, Kelt Exploration increased its natural gas production by 14.2%. Interestingly, the company’s liquids percentage remained the same quarter-over-quarter.
| Company | Q3 (mmcf/d) | Q4 (mmcf/d) | Absolute Change (mmcf/d) | % Change |
| Headwater | 6.1 | 8.0 | 1.9 | 31.1 |
| Baytex | 129.8 | 165.1 | 35.3 | 27.2 |
| Peyto | 520.5 | 623.0 | 102.5 | 19.7 |
| Logan | 24.6 | 29.1 | 4.5 | 18.5 |
| Kelt Exploration | 105.6 | 120.5 | 15.0 | 14.2 |
| Tourmaline | 2318.3 | 2543.2 | 224.9 | 9.7 |
| NuVista | 283.1 | 310.5 | 27.4 | 9.7 |
| Bonterra Energy | 34.2 | 37.2 | 3.0 | 8.7 |
| Whitecap | 323.9 | 351.8 | 27.9 | 8.6 |
| Vermilion | 263.8 | 283.9 | 20.1 | 7.6 |
| Average | 377.6 | 396.6 | 19.0 | 5.0 |
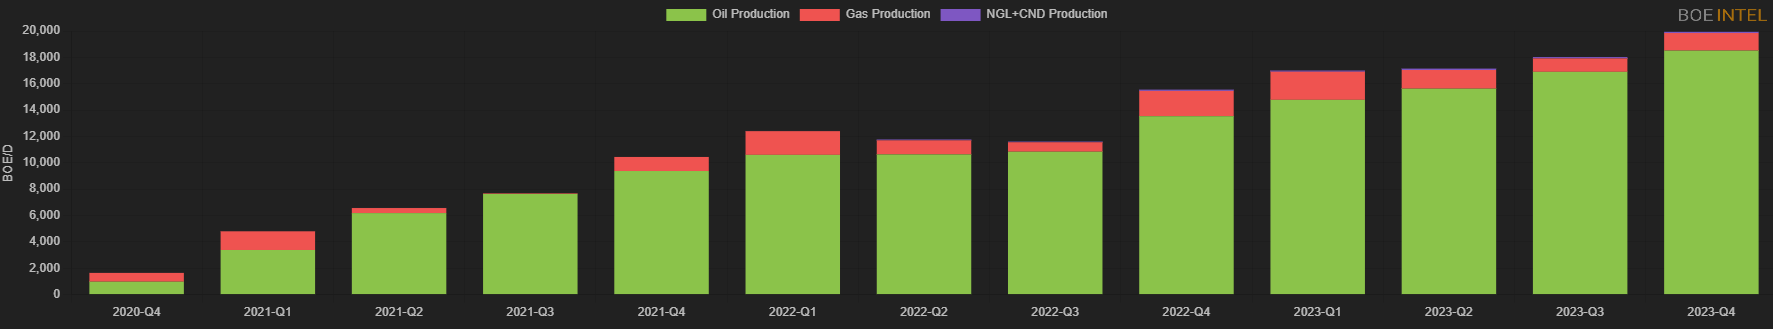
Headwater Corporate Production By Commodity, Q4 2020 – Q4 2023
Liquids Production
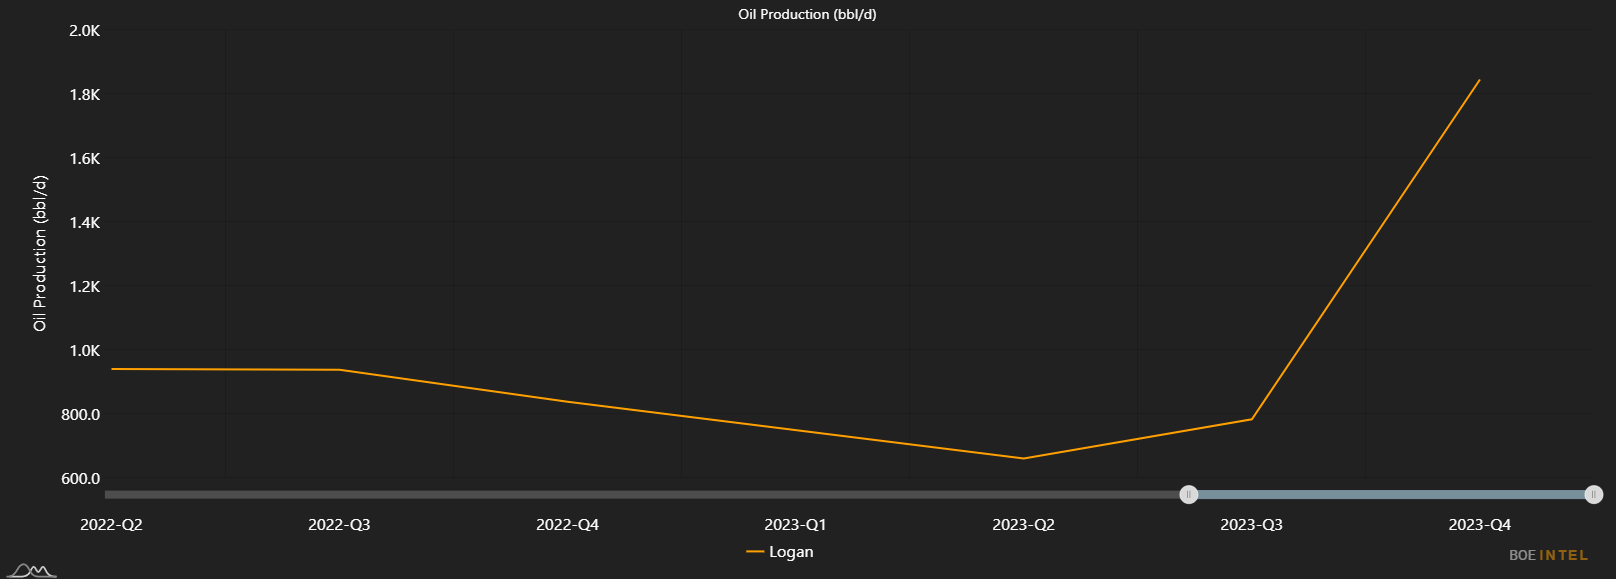
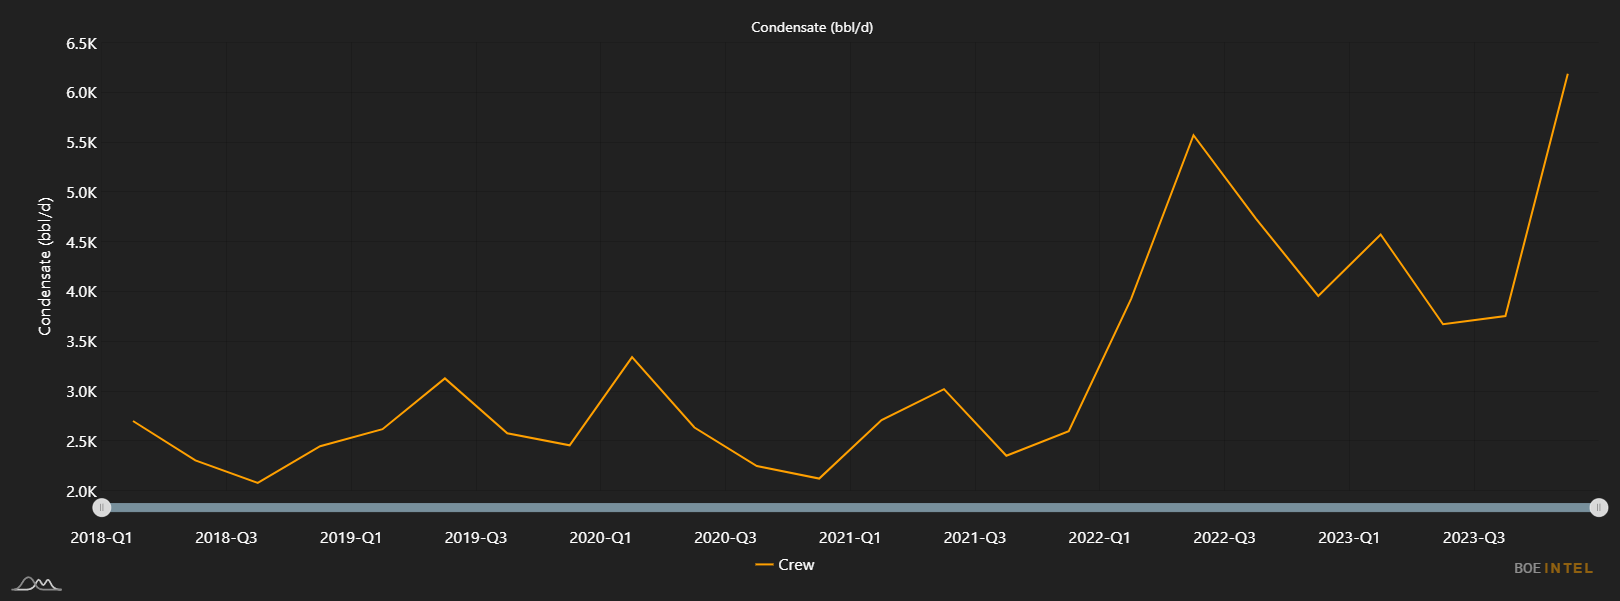
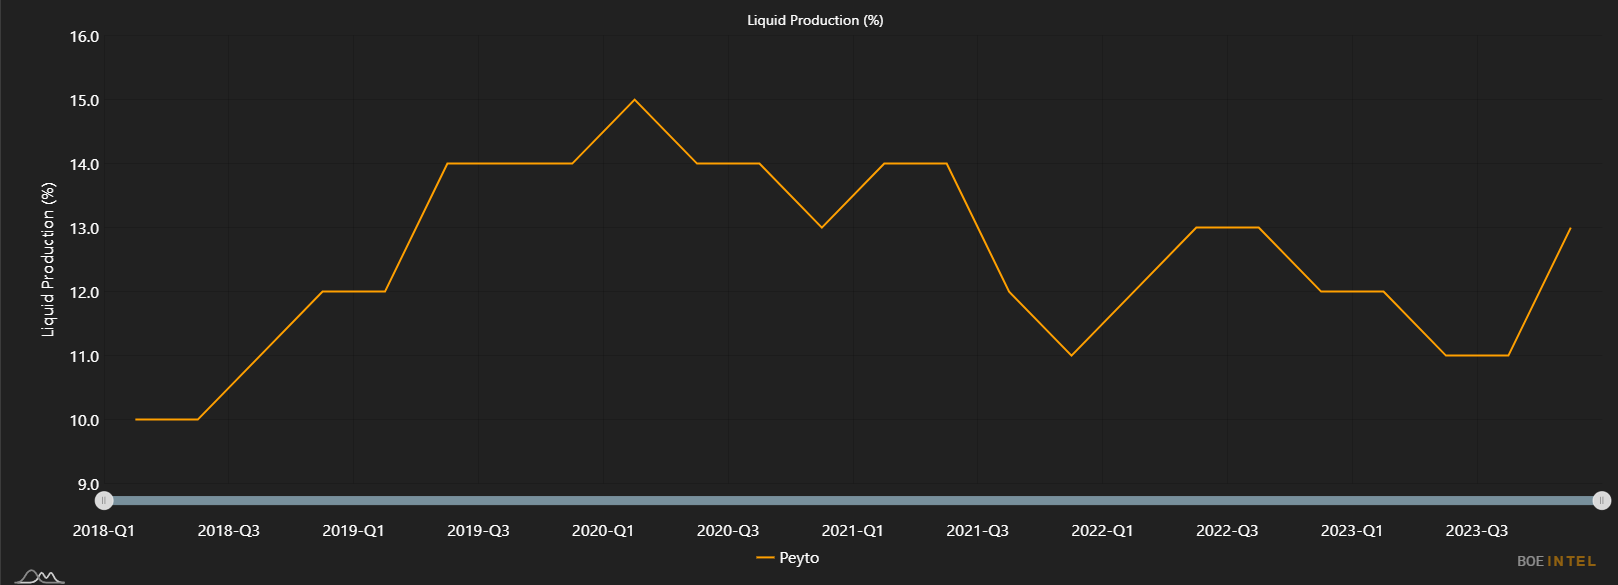
The average company in our dataset grew liquids production by 4.3% compared to the quarter before. The largest proportional growth was from Logan Energy, which more than doubled its liquids production. This production was composed of 362 BBL/d in NGLs, 456 BBL/d in condensate and 1,844 BBL/d in oil, resulting in a 35% liquid portion of total production. Logan is only two quarters removed from its spin-off from Spartan Delta last year, but the company has reported historical production data back to Q2 2022 for the assets it was allocated in the transaction. Most notable is the company’s substantial oil production growth in Q4; Logan’s oil production jumped by over 1,000 BBL/d compared to the prior quarter. Check out Logan’s top well by December 2023 oil production, which came on prod in November 2023, here. Crew Energy attained an impressive 48.3% quarter-over-quarter increase in liquids production in Q4, with the bulk of this increase stemming from boosted condensate output. Crew emphasized increased condensate production in its 2023 capital budget, and this appears to be consistent with its 2024 ambitions as well (see slide 6). The company’s focus on its more condensate rich locations in 2023 allowed Crew’s liquids content to grow from 20% of volumes in Q4/2022 to 28% by Q4/2023. Peyto was the other company that achieved liquids growth of over 40% quarter-over-quarter, although in its case the production boost can largely be attributed to its acquisition of Repsol’s Canadian assets. As a reminder, the Repsol assets produced approximately 25% liquids at the point the transaction was announced compared to Peyto’s 11% liquids production proportion in Q3 2023.
| Company | Q3 (BBL/d) | Q4 (BBL/d) | Absolute Change (BBL/d) | % Change |
| Logan | 1,298 | 2,662 | 1,364 | 105.1 |
| Crew Energy | 5,879 | 8,716 | 2,837 | 48.3 |
| Peyto | 11,231 | 16,175 | 4,944 | 44.0 |
| Rubellite | 3,176 | 4,322 | 1,146 | 36.1 |
| Kiwetinohk | 9,132 | 11,914 | 2,782 | 30.5 |
| Kelt Exploration | 10,586 | 12,254 | 1,668 | 15.8 |
| Tourmaline | 116,138 | 133,093 | 16,955 | 14.6 |
| InPlay Oil | 5,117 | 5,662 | 545 | 10.7 |
| Ovintiv | 300,900 | 331,100 | 30,200 | 10.0 |
| Gear Energy | 4,724 | 5,184 | 460 | 9.7 |
| Average | 88,466 | 92,298 | 3,832 | 4.3 |
Operating Cash Flow
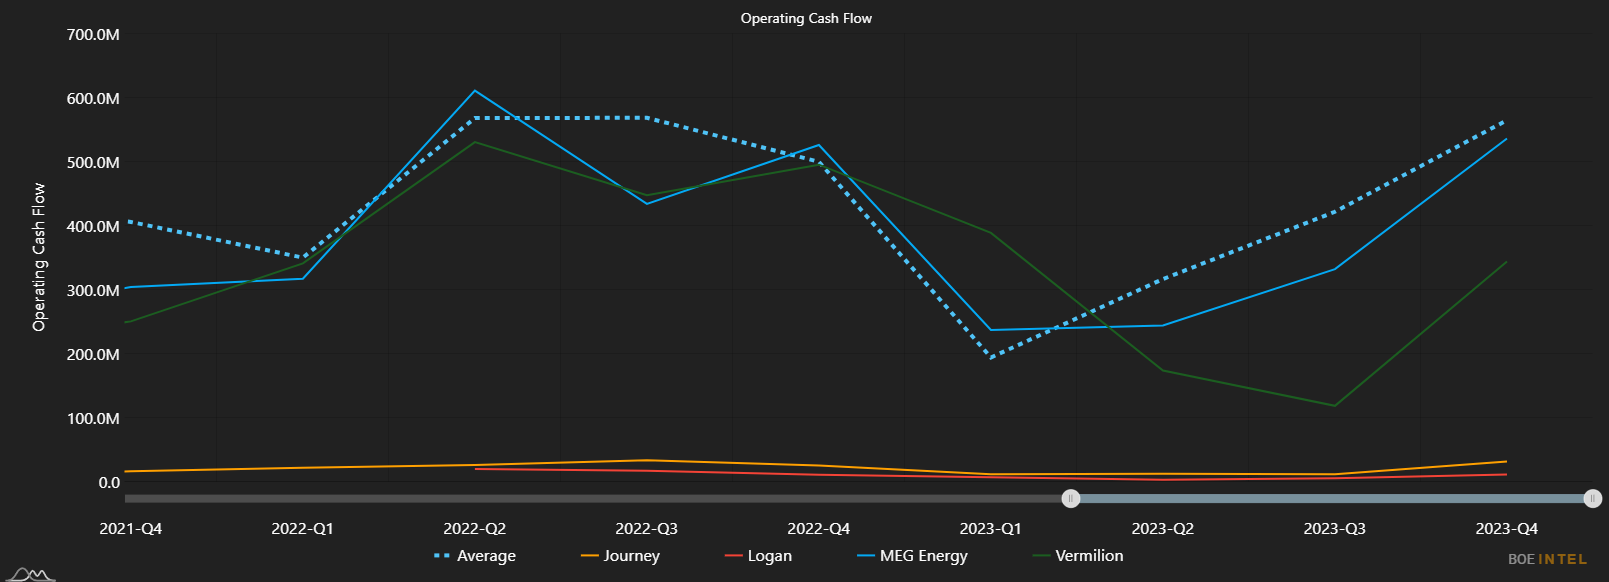
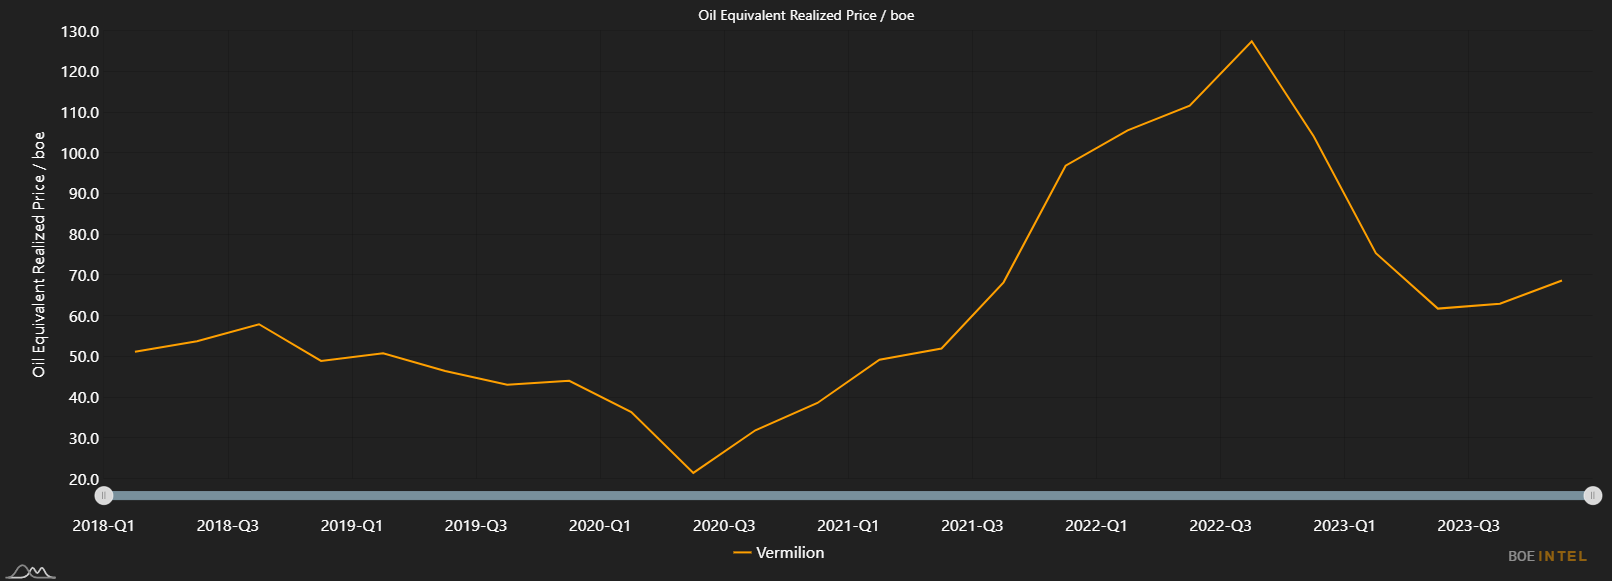
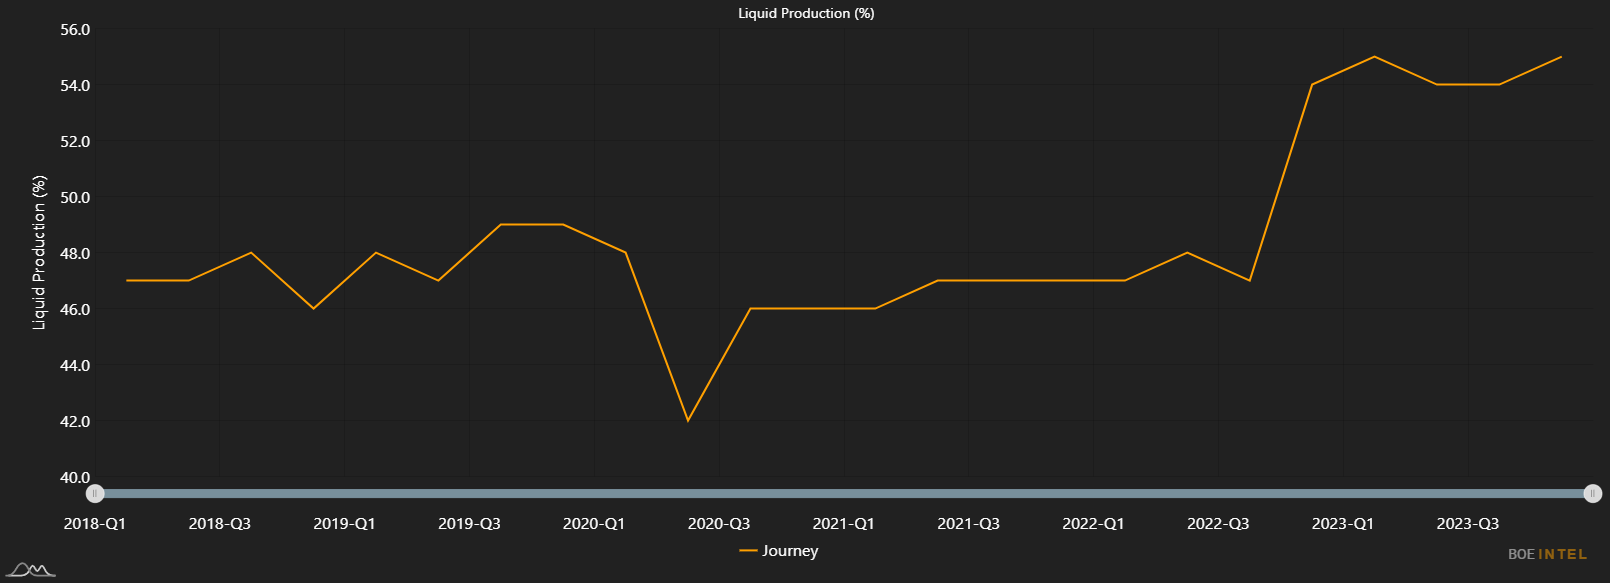
It was a strong financial quarter for many Canadian E&Ps, with the average company increasing operating cash flow by 11.7%. Vermilion, Journey, and Logan led the way in quarterly growth; each more than doubled their operating cash flows compared to the previous quarter. In Vermilion’s case, operating cash flow jumped by over 190%, an impressive turnaround after a depressed third quarter. An increase of just under 5,000 BOE/d in average corporate production helped, but changes in realized pricing appear to be the more significant factor. Vermilion is exposed to a complex commodity pricing environment on account of its range of international producing assets, and the company’s realized pricing per BOE increased from $62.92/BOE in Q3 to $68.64/BOE in Q4. Conversely, Journey Energy increased its operating cash flow by 170.4% on account of improved production and in spite of worsened realized pricing outcomes. The company’s liquids portion of production increased in the quarter, meaning that the company was producing higher value commodities compared to Q3. MEG Energy grew its operating cash flow by over 60% quarter-over-quarter, although it appears that this was likely in part due to an adjustment to its non-cash working capital as opposed to an increase in revenue.
| Company | Q3 (M$) | Q4 (M$) | Absolute Change (M$) | % Change |
| Vermilion | 118,436 | 343,831 | 225,395 | 190.3 |
| Journey | 11,569 | 31,278 | 19,709 | 170.4 |
| Logan | 5,158 | 11,176 | 6,018 | 116.7 |
| MEG Energy | 332,000 | 536,000 | 204,000 | 61.4 |
| Ovintiv | 1,214,946 | 1,849,467 | 634,521 | 52.2 |
| Paramount | 207,600 | 287,000 | 79,400 | 38.2 |
| Canadian Natural Resources | 3,498,000 | 4,815,000 | 1,317,000 | 37.7 |
| NuVista | 160,194 | 211,761 | 51,567 | 32.2 |
| Crew Energy | 45,056 | 58,721 | 13,665 | 30.3 |
| Rubellite | 14,957 | 18,963 | 4,006 | 26.8 |
| Average | 532,277 | 594,421 | 62,144 | 11.7 |
Net Debt
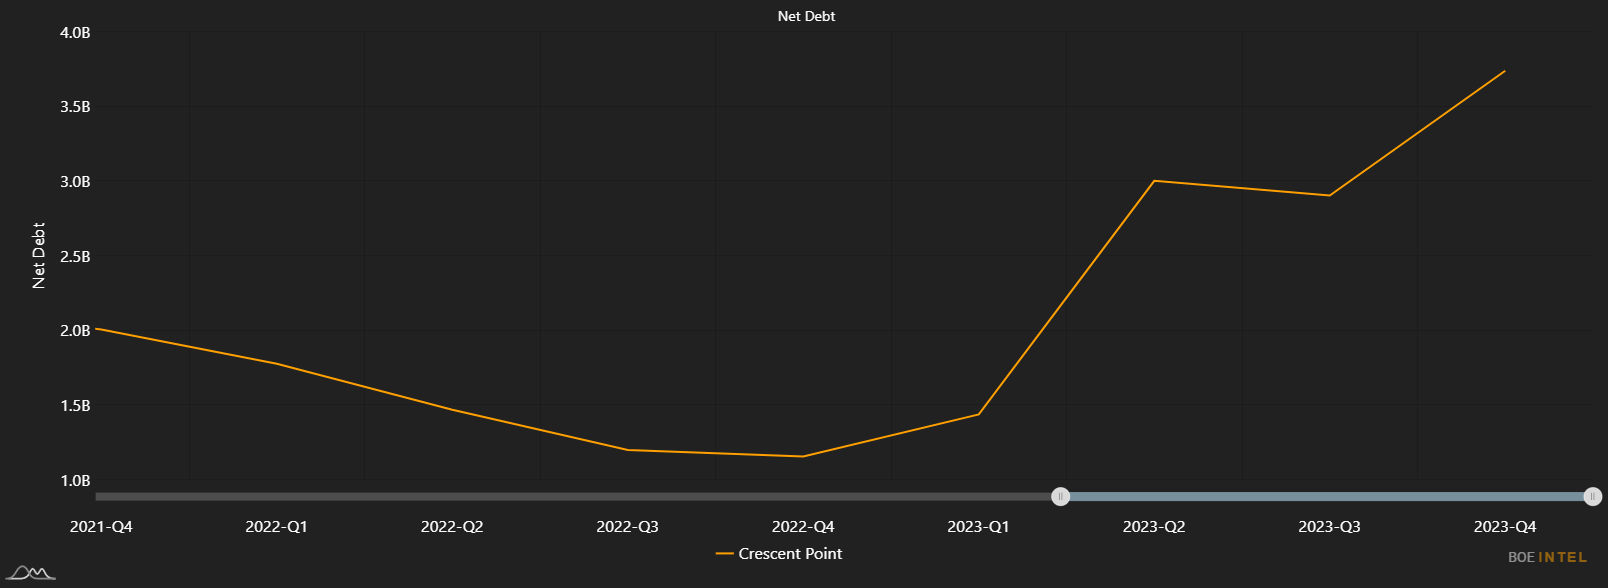
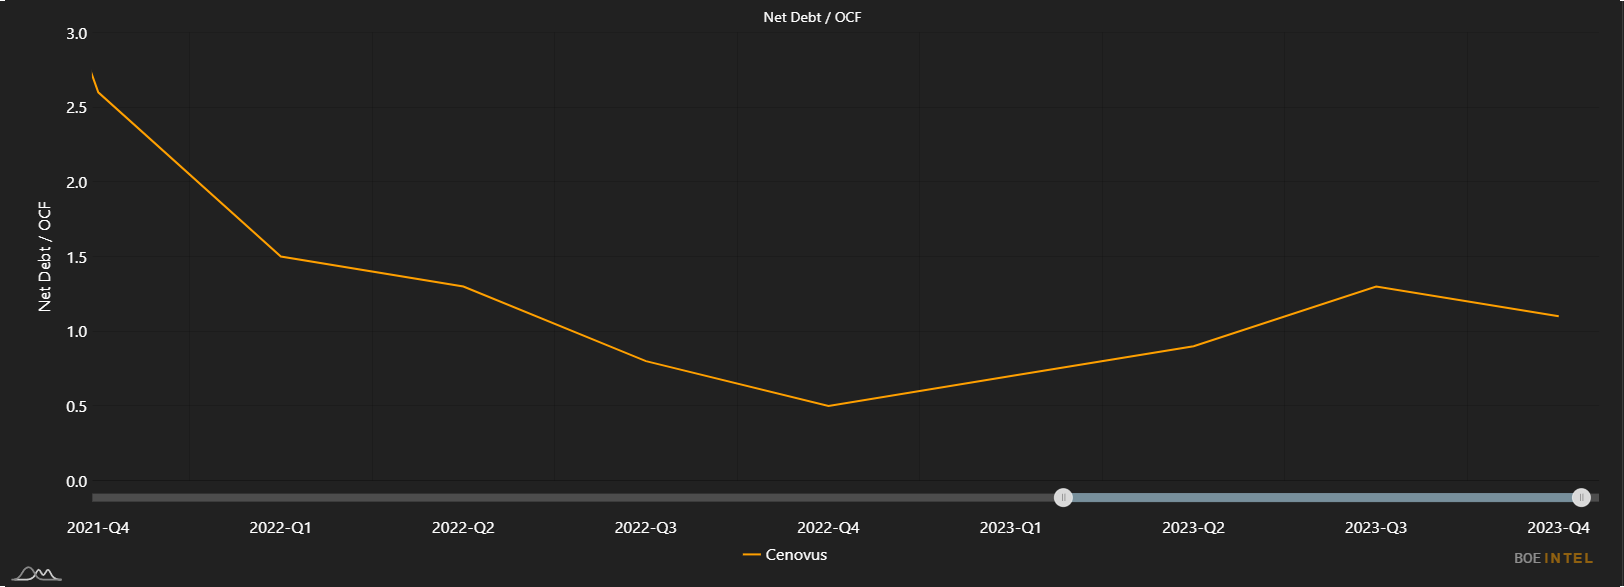
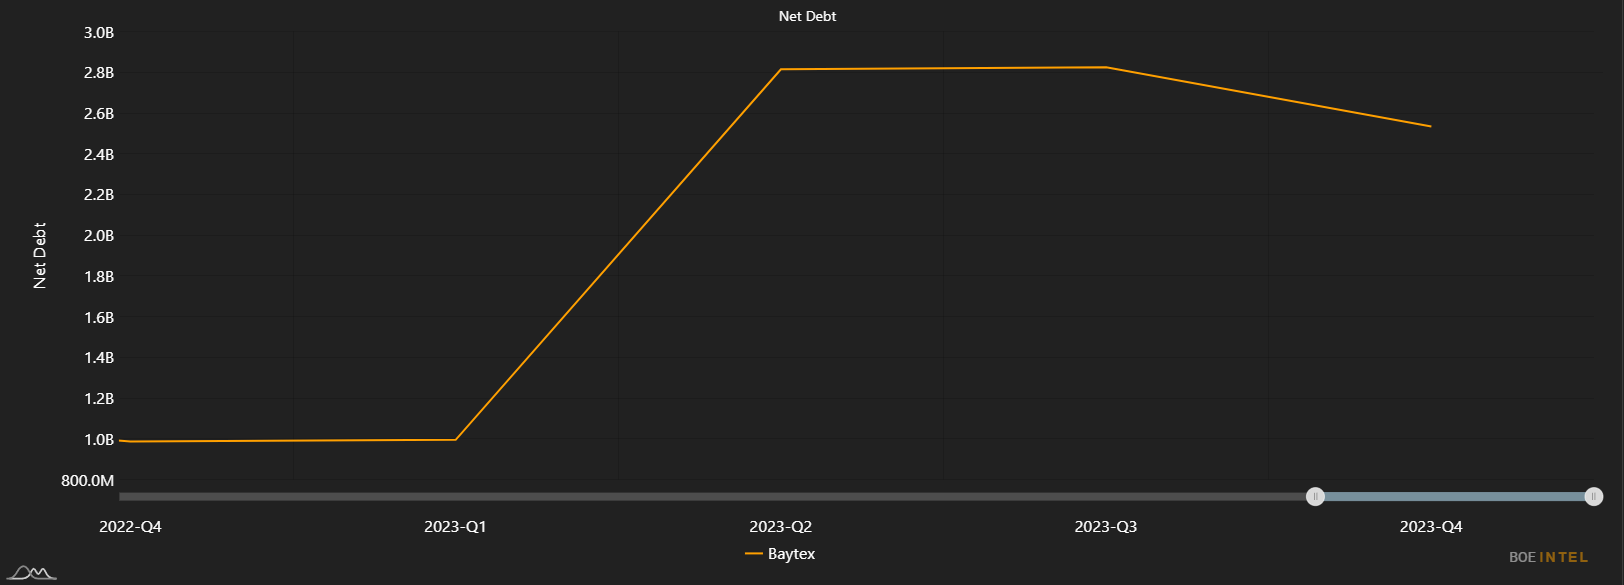
We will begin this section with our usual disclaimer: net debt changes aren’t necessarily good or bad. Companies will often decrease debt after attaining healthy cash flow levels, but they may also take on debt to acquire assets that will (hopefully) boost cash flow in the future. As readers will see in the table below, the oil patch saw a bit of both in Q4 2023. The average company saw a very modest $4.59 million decrease in net debt this quarter, suggesting that on average the industry is about as leveraged as they were at the end of Q3. All of the top 5 companies with respect to debt growth completed major acquisitions in the second half of 2023. Tourmaline took on a large amount of debt to finance its acquisition of Bonavista, which involved a consideration of $725 million in cash (less Bonavista’s net debt) and $725 million in shares. According to the company’s Q4 2023 results announcement, Tourmaline “intends to deleverage throughout 2024 and remains committed to a long-term net debt target of $1.2-1.4 billion”. Suncor Energy’s net debt grew by a similar amount, likely as a result of a similarly sized transaction that closed in October 2023. Suncor acquired TotalEnergies’ Canadian operations, namely a working interest in the Fort Hills project, for a total consideration of just under $1.5 billion. Whitecap, which saw its net debt increase by $125 million, announced a $154 million tuck-in Viking light oil acquisition earlier this year. With respect to companies that reduced debt by the largest amounts, CNRL and Cenovus were obvious standouts. CNRL reduced its net debt by over $1.5 billion, bringing the company well within its target debt range. Similarly, Cenovus deleveraged substantially, decreasing its net debt balance by 15.3% in Q4. According to the company’s March 2024 corporate presentation, Cenovus remains in a net debt range where up to 50% of excess free funds flow will be allocated to debt repayment. Baytex also reduced its net debt level by over 10%, which appears to be the company’s first major reduction of net debt since the acquisition of Ranger last year. According to its March 2024 corporate presentation, the company has a total debt target of $1.5 billion.
| Company | Q3 2023 (M$) | Q4 2023 (M$) | Absolute Change (M$) |
| Top 5 | |||
| Tourmaline | 879,799 | 1,779,732 | 899,933 |
| Crescent Point | 2,902,300 | 3,738,100 | 835,800 |
| Suncor | 12,995,000 | 13,678,000 | 683,000 |
| Peyto | 877,011 | 1,362,777 | 485,766 |
| Whitecap | 1,260,200 | 1,385,500 | 125,300 |
| Bottom 5 | |||
| Vermilion | 1,242,522 | 1,078,567 | -163,955 |
| MEG Energy | 1,198,000 | 964,000 | -234,000 |
| Baytex | 2,824,348 | 2,534,287 | -290,061 |
| Cenovus | 5,976,000 | 5,060,000 | -916,000 |
| Canadian Natural Resources | 11,519,000 | 9,922,000 | -1,597,000 |
| Average | 1,367,044 | 1,362,455 | -4,589 |