The following two charts show the production breakdown by commodity type for all producers in Canada with gross licensed production greater than 30,000 BOE/d. This is not meant to represent the exact breakdown on a corporate basis, as these are gross volumes, for Canada only, won’t account for international production or oil sands mining volumes, or any shared working interest or non-operated production, but should still provide a good visual as to the value of a company’s production.
Click here to see the underlying data and for every producer in Canada in our Overview Tables in BOE Intel. Users can also choose to display this data based on corporately reported production instead of public data production, in cases where companies break down production by commodity.
Figure 1 shows the breakdown by commodity type for each producer. Figure 2 shows the breakdown of only the liquids production, and is sorted from left to right based on % liquids production (as is Figure 1).
Figure 1 – Production breakdown by commodity type – Gross Canadian volumes (ex-oil sands mining)*

*Volumes reported on a gross licensed basis, public data only. April 2024 production data, and only include Canadian volumes. Does not account for any oil sands mining production.
Figure 2 – Liquids breakdown – Gross Canadian volumes (ex-oil sands mining)*
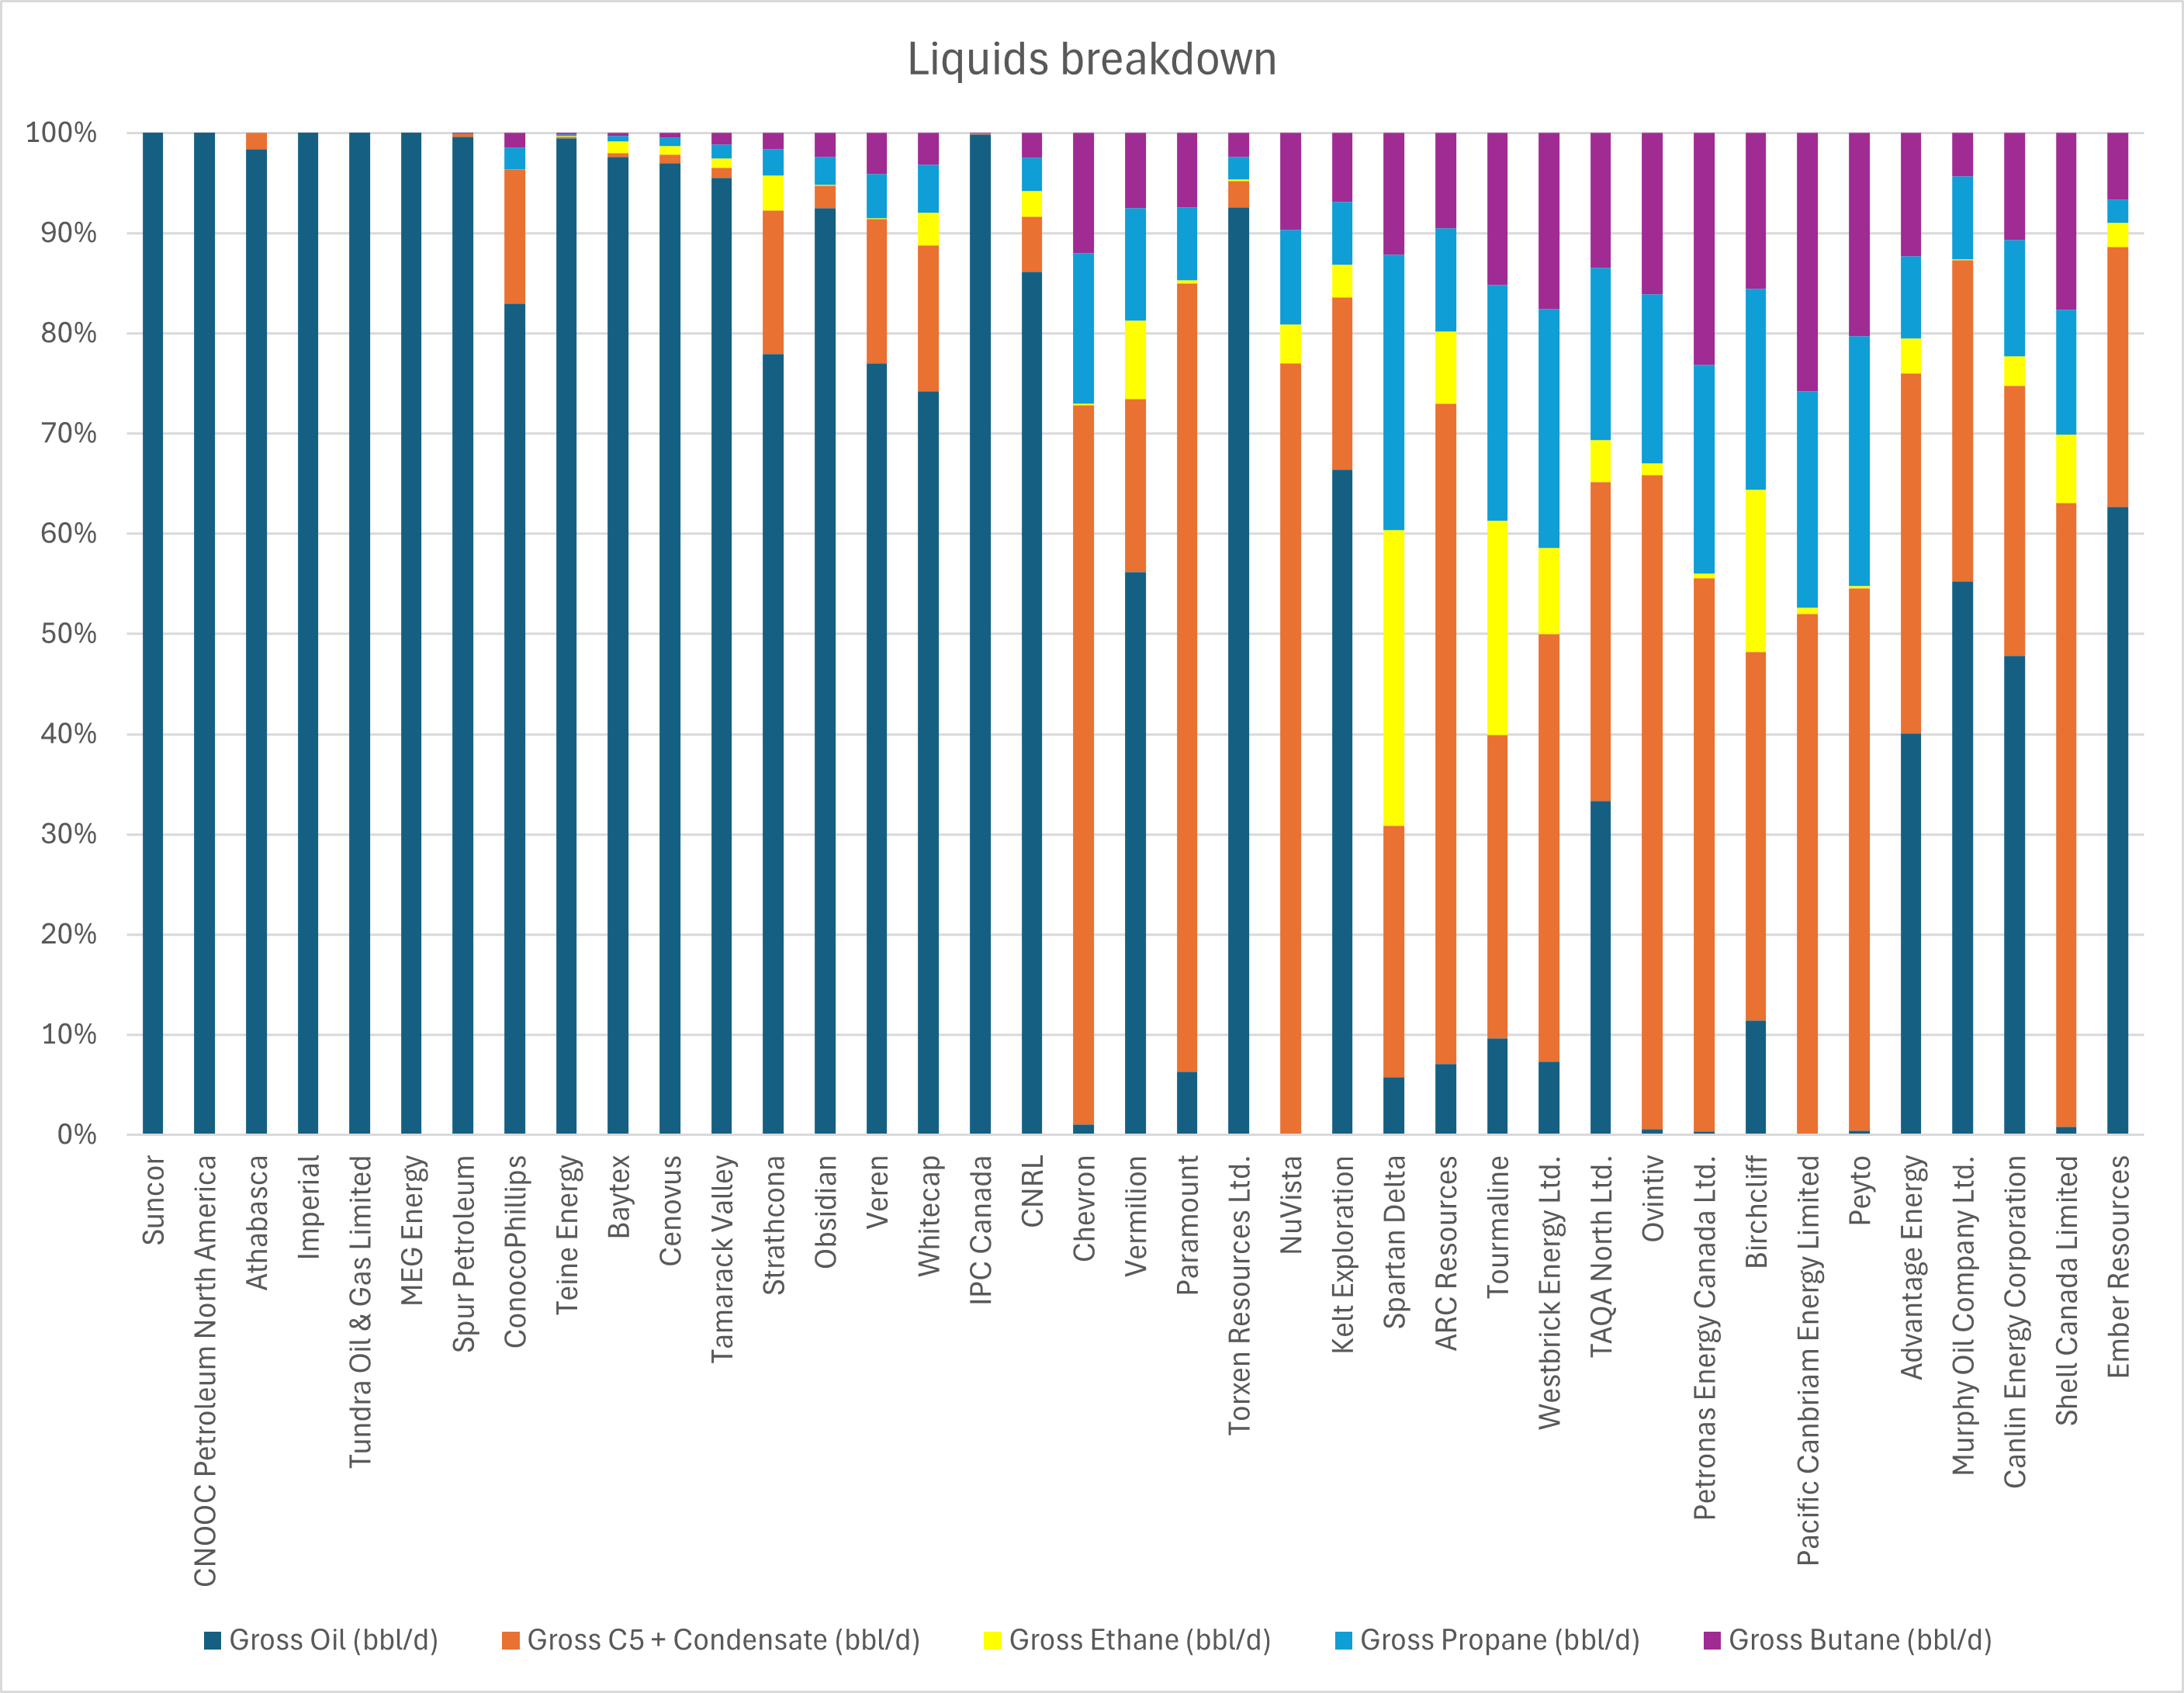
*Volumes reported on a gross licensed basis, public data only. April 2024 production data, and only include Canadian volumes. Does not account for any oil sands mining production.