• Sign up for the Daily Digest E-mail
  • Facebook
  • X
  • LinkedIn

BOE Report

Sign up
  • Home
  • StackDX Intel
  • Headlines
    • Latest Headlines
    • Featured Companies
    • Columns
    • Discussions
  • Well Activity
    • Well Licences
    • Well Activity Map
  • Property Listings
  • Land Sales
  • M&A Activity
    • M&A Database
    • AER Transfers
  • Markets
  • Rig Counts/Data
    • CAOEC Rig Count
    • Baker Hughes Rig Count
    • USA Rig Count
    • Data
      • Canada Oil Market Data
      • Canada NG Market Data
      • USA Market Data
      • Data Downloads
  • Jobs

2020 average rig count down 50 from 2019; down 114 from 2018

January 29, 20214:45 AM BOE Report Staff

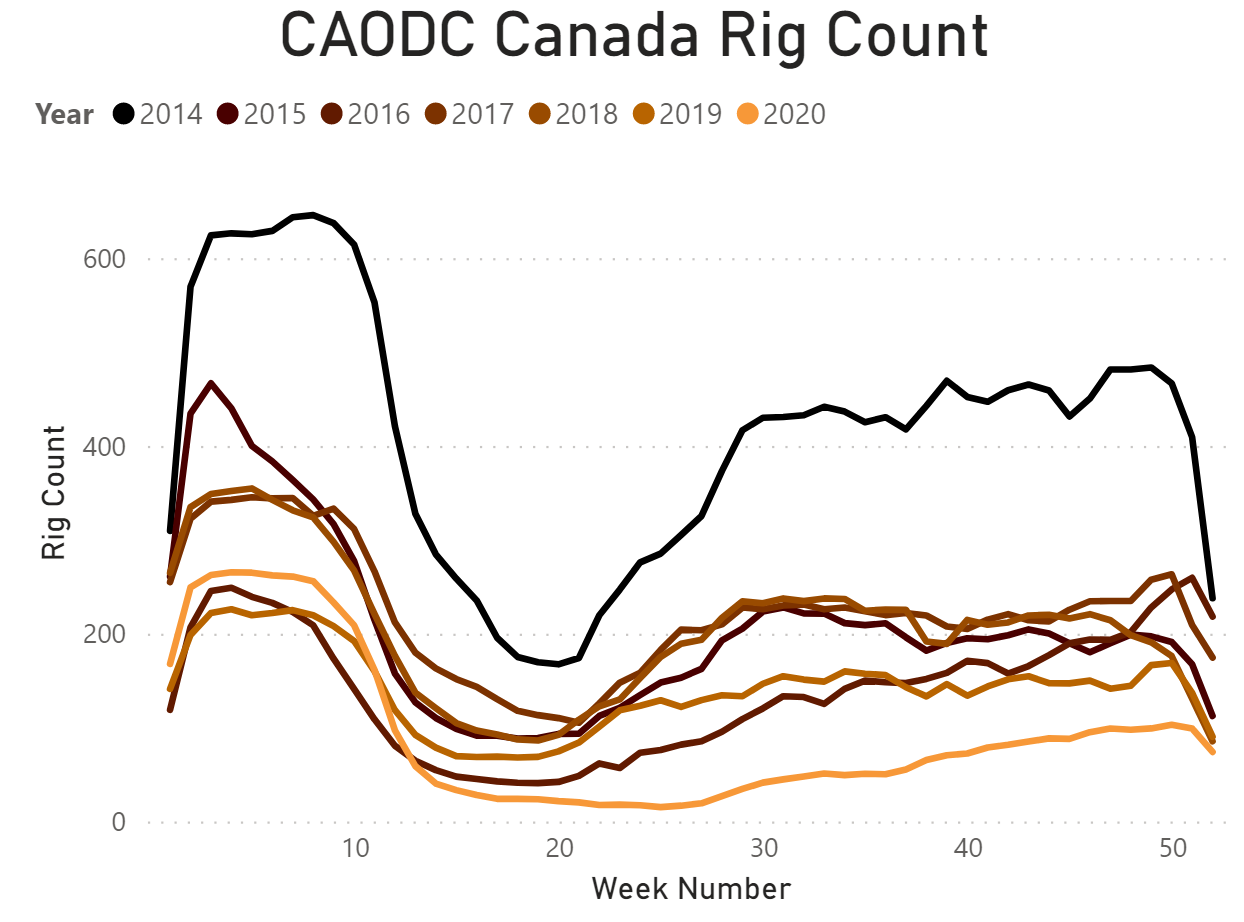
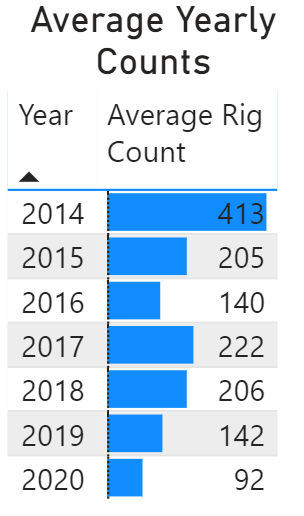
The 2020 Canada rig count average finished the year 50 rigs lower than in 2019 (from 142 to 92). Compared to 2018, 2020 finished 114 rigs lower, on average. Compared to the recent high in 2014, the rig count is a mere 22% of its 2014 count of 413.

2020 started the year off strong, with counts more optimistic than 2016 and 2019, just under 2017 and 2018. When the covid-19 pandemic hit in March, the sudden drop caused 2020 rigs counts to drop below the recent lows in 2016; counts hit as low as 15 rigs halfway through 2020.

The rotary rig count, a measure of the active drilling rigs drilling new oil and gas wells, is representative of the growth in oil and gas production capacity. Rig counts tend to fluctuate week-to-week and season-to-season, with most drilling activity happening outside of the wet springs months.

This holistic view of the CAODC rig count shows both seasonal and year-to-year changes in rig counts. Summarized in the bar chart/table on the right, the annual average rig counts give a glimpse of the drilling activity over the past 7 years.

Explore the rig count report by adjusting filters on the right side, clicking on years in the table, and hovering over lines in the graph.

Visit this story on your desktop computer to explore our interactive rig count report. Rig count line graph, where each year is its own series
Rig count bar chart by year

Explore the BOE Report’s rig count data with our other interactive rig count tools: CAODC rig count (Canada), and Baker Hughes US rig count.

Stay tuned for the upcoming release of the BOE Report’s drilling rig map, powered by the CAODC.

Follow BOE Report
  • Facebook
  • X
  • LinkedIn

Sign up for the BOE Report Daily Digest E-mail

Successfully subscribed

Latest Headlines
  • New oil and gas jobs from BOE Report Jobs
  • Discount on Western Canada Select at widest point since March
  • Advantage Announces 2026 Budget, Featuring Strong Per-Share Growth with Accelerating Free Cash Flow Outlook
  • New Report Shows Canadian Energy Exports Can Cut Global Emissions by Displacing U.S LNG, Coal, and Dirtier Oil Alternatives
  • US natural gas futures drop 7% for second day as mild weather trims demand

Return to Home
Alberta GasMonthly Avg.
CAD/GJ
Market Data by TradingView

    Report Error


    Note: The page you are currently on will be sent with your report. If this report is about a different page, please specify.

    About
    • About BOEReport.com
    • In the News
    • Terms of Use
    • Privacy Policy
    • Editorial Policy
    Resources
    • Widgets
    • Notifications
    • Daily Digest E-mail
    Get In Touch
    • Advertise
    • Post a Job
    • Contact
    • Report Error
    BOE Network
    © 2025 Stack Technologies Ltd.