
Each week, XI Technologies scans its unique combination of enhanced industry data to provide trends and insights that have value for professionals doing business in the WCSB. If you’d like to receive our Wednesday Word to the Wise in your inbox, subscribe here.
With major mergers dominating the headlines of the oil and gas industry, we thought it would be helpful to take the data at our disposal and use it to look at a recent merger. We’ll look at each company from a high-level perspective prior to the merge. What did the companies look like before they merged? Does a comparison between the two offer insights and what does one area of interest look like holistically after the merger?
We’ve provided images to look at the companies pre-merger to provide some insight:
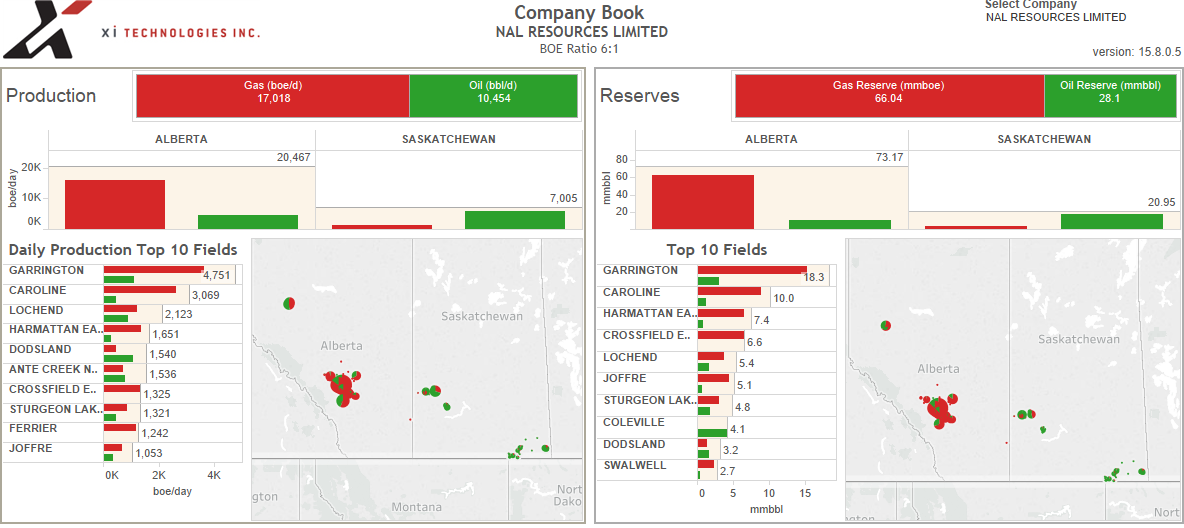
Figure 1 – NAL Resources prior to the merger
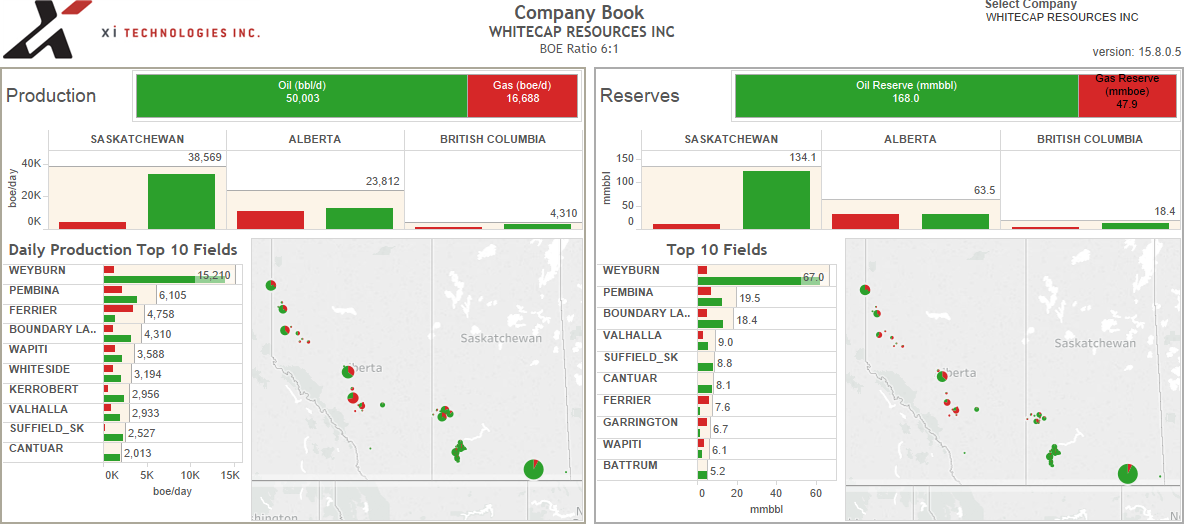
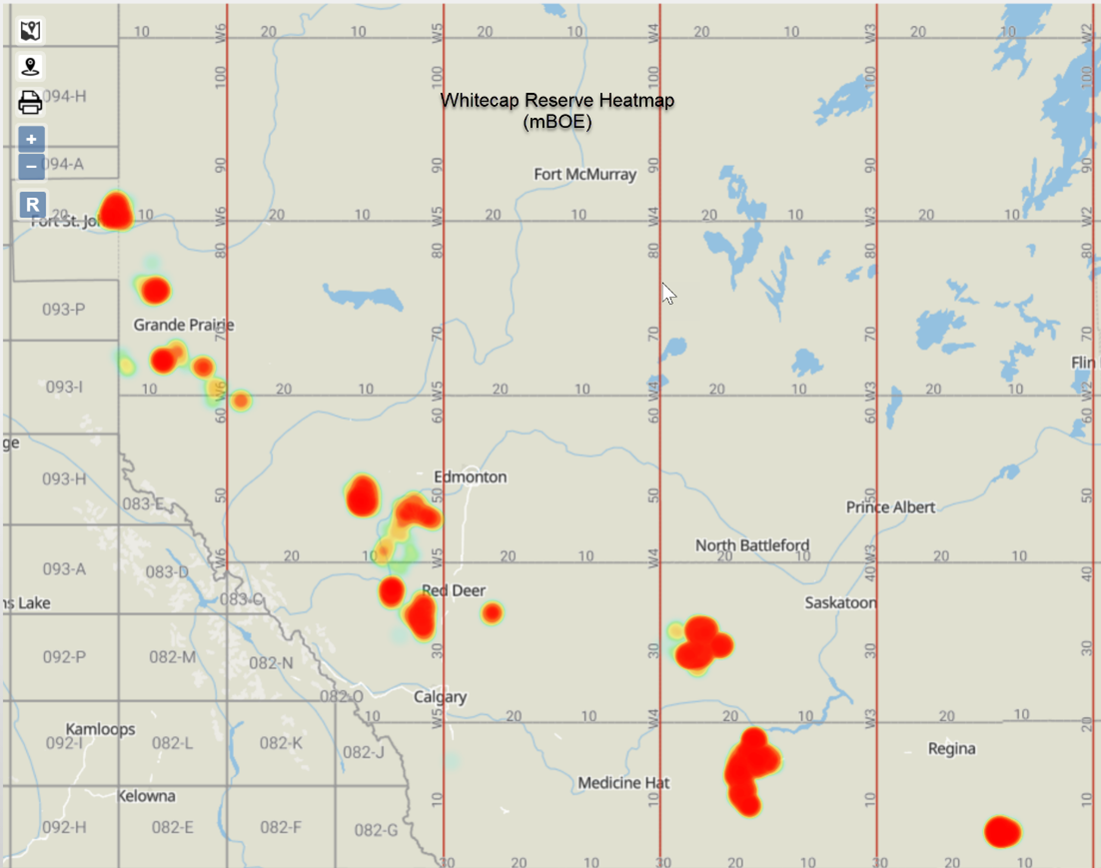
Figure 2 – Whitecap Resources prior to the merger.
Click here to download a pdf report of the above data, including land and drilling history data.
Core Areas
Whitecap’s press release was very clear that the deal strengthened their current core operating area. There are some interesting pieces of information that we could have looked at in advance of this merger to predict and confirm this:
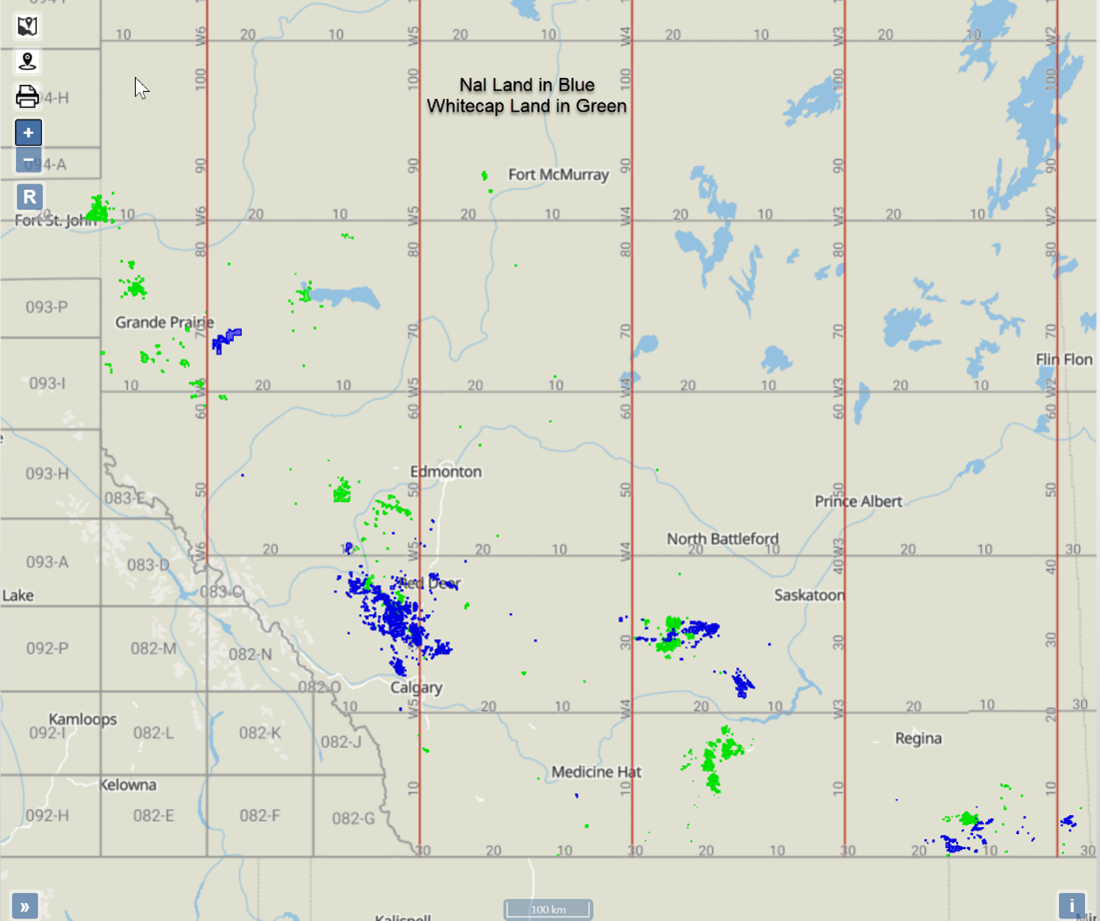
- Land holdings — When looking at NAL and Whitecap side-by-side, there is very little daylight between their land holdings. NAL is more concentrated in the Harmattan East to Garrington fields that run between Calgary and Red Deer, but overall, their lands are complementary.
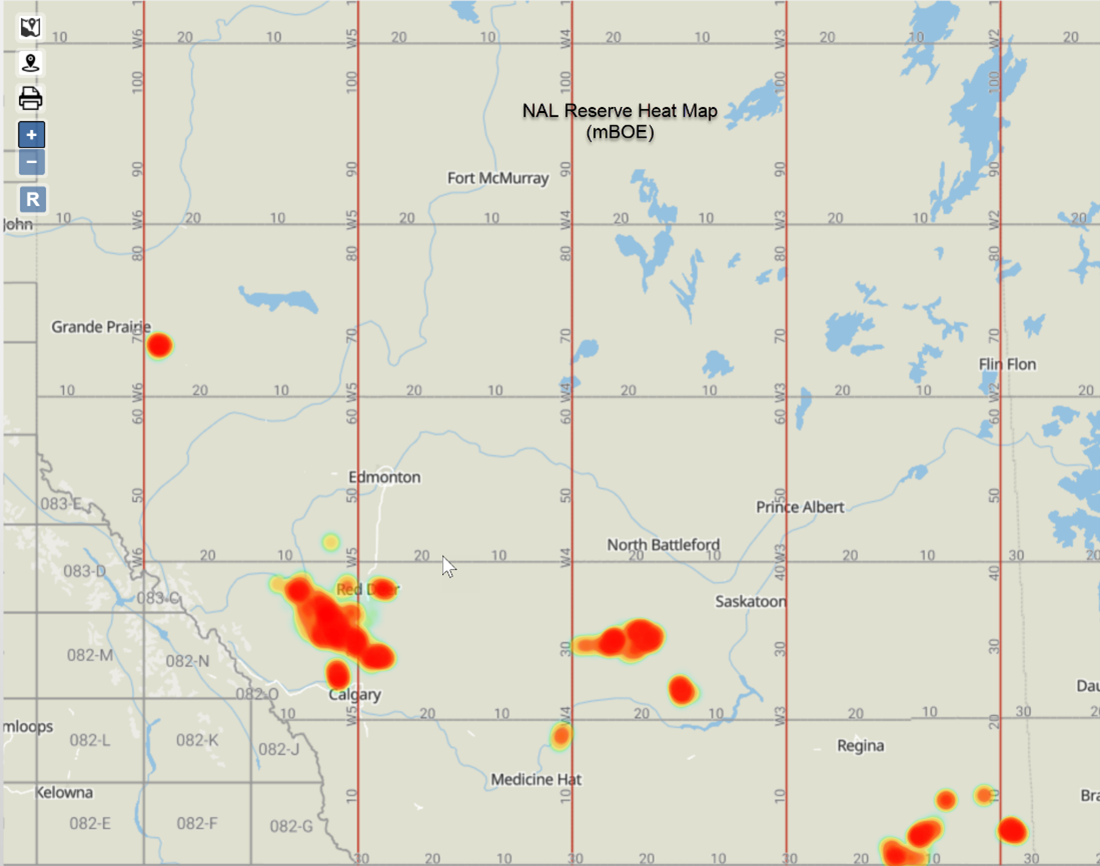
- Decline reserves — Again, like land, this paints a strong overlapping picture with most of NAL production coming from the same area of their land concentration to complement Whitecap’s operations.
- Synergy operations — Here is where these parties diverge. In XI’s experience, often merger or acquisitions are done with players that are current partners. In the Whitecap/NAL deal, less than 1% of the production was jointly owned prior to the merger. NAL’s largest synergy partner was TORC Oil and Gas Ltd, foreshadowing the next deal to some degree.
With XI’s AssetSuite tools you can dig into pools, undeveloped land holdings and other parameters to assist you with finding acquisition and divestiture deals like this one. XI also allows you to look at overall risk with inactive wells and ARO obligations to ensure there are no surprises with the deal.
Recent Development & Drilling Activity
Much of NAL’s drilling in the last two years has been focused in Dodsland and Ferrier, which are two fields that Whitecap is also actively developing. If projecting future drilling for Whitecap, we can assume that momentum here will continue.
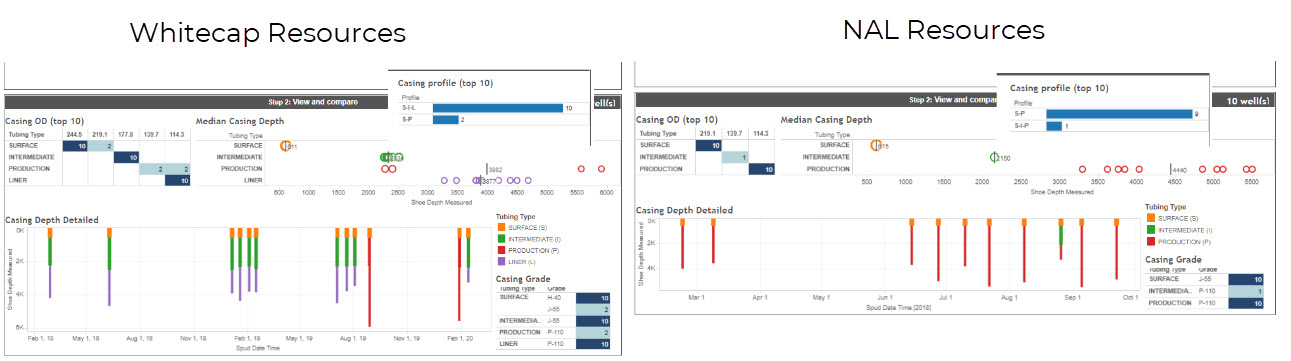
With some notable variances in well design, perhaps knowledge transfer is a factor behind the acquisition? For example, a closer look at the companies’ Cardium drilling in Central AB shows that NAL is using more monobore drilling. Since 2018, NAL has mostly drilled monobore, where Whitecap has used a 3-string design using liner other than in Aug 2019 and Feb 2020 when Whitecap tried monobore but switched back to 3-string two weeks later.
Using data from Offset Analyst, you can continue to explore best practices in drilling and analyze drill curves to predict your cost.
Area Outlook
Let’s look at the field with most overlap with these two companies, Garrington. Whitecap becomes the biggest player in this area, with 54.36% of the total production. In fact, 83% of the production in this area is now held in the hands of four companies.
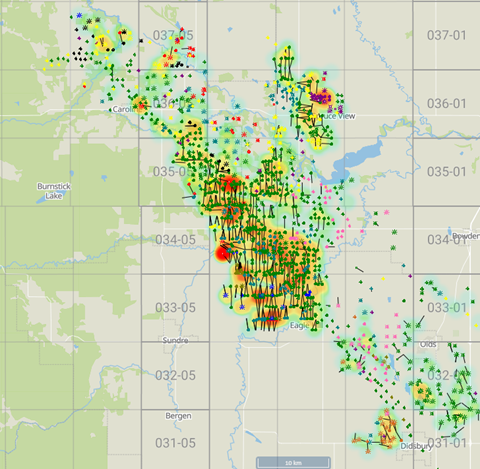
Figure 3 – Heat map of Garrington showing the top 10 companies overlaid.
If you’d like to learn more about how XI’s AssetSuite and OffsetAnalyst software can analyze potential mergers and acquisitions, contact XI Technologies.