Following off of Part 1 of our Q3 2023 Earnings Season Report Card, which focused on production and financial metrics, we are looking at per-BOE indicators in Part 2. Shifts in commodity prices impacted Canadian producers in various ways this quarter, particularly for oil-weighted companies which benefitted from favourable macro trends. Cost inflation might even be in the process of subsiding, as we observed cost declines across categories in Q3.
This analysis was made possible with BOE Intel. Our data and analytics platform can keep you up to date on all of the latest developments in the Canadian oil patch.
Operating Costs
After several quarters of operating cost inflation, we appear to be seeing a potential abatement in pricing pressures. Operating costs declined by $0.46/BOE for the average company in our dataset, compared to an increase of $0.20/BOE last quarter. Among the top operating cost performers, we noticed a few patterns. Hemisphere Energy, which reduced its operating costs by $2.53/BOE, led all companies. Relative to 2022, the company’s operating costs increased through 2023 on account of the company’s expanded utilization of EOR chemical additives; the noteworthy decrease this quarter may suggest a cost normalization. Hammerhead’s decreased operating costs were likely a result of economies of scale, given that the company set a production record in the quarter. Spartan Delta also saw improved operating costs this quarter, although it’s important to note that the company realized a $1.8 million operating cost recovery relating to prior year equalization payments and a one-time accrual reversal adjustment due to the company’s asset sale to Crescent Point earlier this year.
| Company | Q3 2023 ($/BOE) | Q2 2023 ($/BOE) | Absolute Change ($/BOE) |
| Hemisphere | 9.19 | 11.72 | -2.53 |
| Hammerhead | 6.99 | 9.51 | -2.52 |
| Spartan Delta | 5.39 | 7.73 | -2.34 |
| Baytex | 12.57 | 14.62 | -2.05 |
| Athabasca | 13.90 | 15.82 | -1.92 |
| Journey | 22.66 | 24.57 | -1.90 |
| Vermilion | 16.26 | 17.91 | -1.65 |
| Saturn | 21.82 | 23.38 | -1.57 |
| Rubellite | 5.76 | 7.22 | -1.46 |
| Tamarack Valley | 8.72 | 10.09 | -1.36 |
| Average | 11.82 | 12.28 | -0.46 |
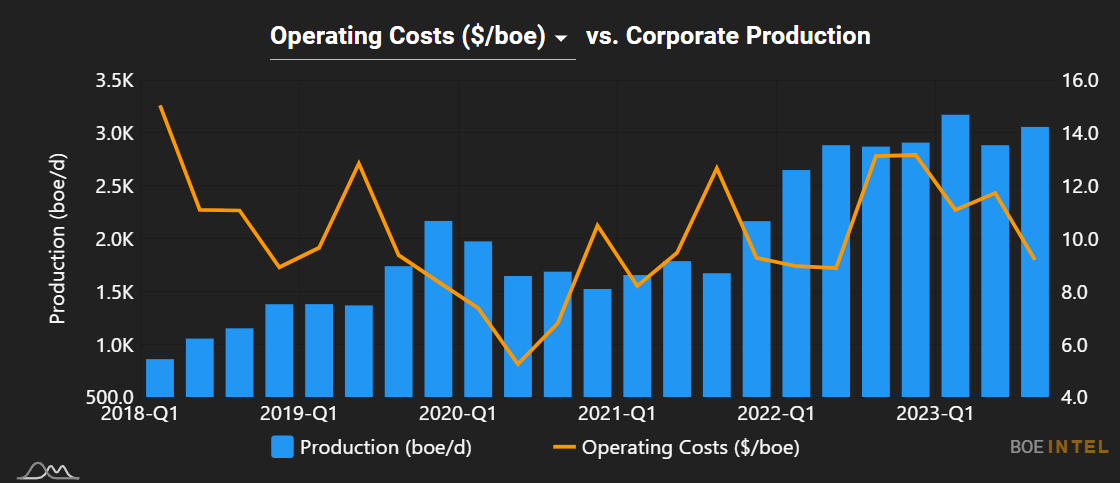
Hemisphere Energy Operating Costs and Corporate Production
Transportation Costs
Like operating costs, transportation costs were down in the industry this quarter. For the average company in our dataset, Q3 brought a modest $0.18/BOE reduction in transportation costs. MEG Energy’s improvement this quarter led all companies by a wide margin. Our guess is that this is largely due to the fact that the company completed a turnaround in Q2, which in turn led to decreased production and reduced economies of scale. Spartan Delta, which also featured in the operating cost top 3, saw a $0.85/BOE reduction compared to Q2. This was likely driven by the company’s asset sale shifting its overall production mix towards natural gas, as gas carries a lower transportation cost compared to oil. Ovintiv’s improved transportation cost outcomes were likely primarily due to an increased share of corporate production coming from the company’s US assets, which have significantly lower associated costs (in Q3, Ovintiv’s Canadian transportation cost was US$12.36/BOE compared to US$3.98/BOE in the US).
| Company | Q3 2023 ($/BOE) | Q2 2023 ($/BOE) | Absolute Change ($/BOE) |
| MEG Energy | 16.83 | 20.01 | -3.18 |
| Spartan Delta | 1.71 | 2.56 | -0.85 |
| Ovintiv | 9.92 | 10.72 | -0.79 |
| Advantage Energy | 3.70 | 4.34 | -0.64 |
| NuVista | 4.91 | 5.52 | -0.61 |
| Gear Energy | 3.28 | 3.75 | -0.47 |
| Kiwetinohk | 5.59 | 6.06 | -0.47 |
| ARC Resources | 4.94 | 5.34 | -0.40 |
| Athabasca | 6.72 | 7.04 | -0.32 |
| Surge Energy | 1.31 | 1.59 | -0.28 |
| Average | 4.11 | 4.29 | -0.18 |
MEG Energy Transportation Cost by Quarter
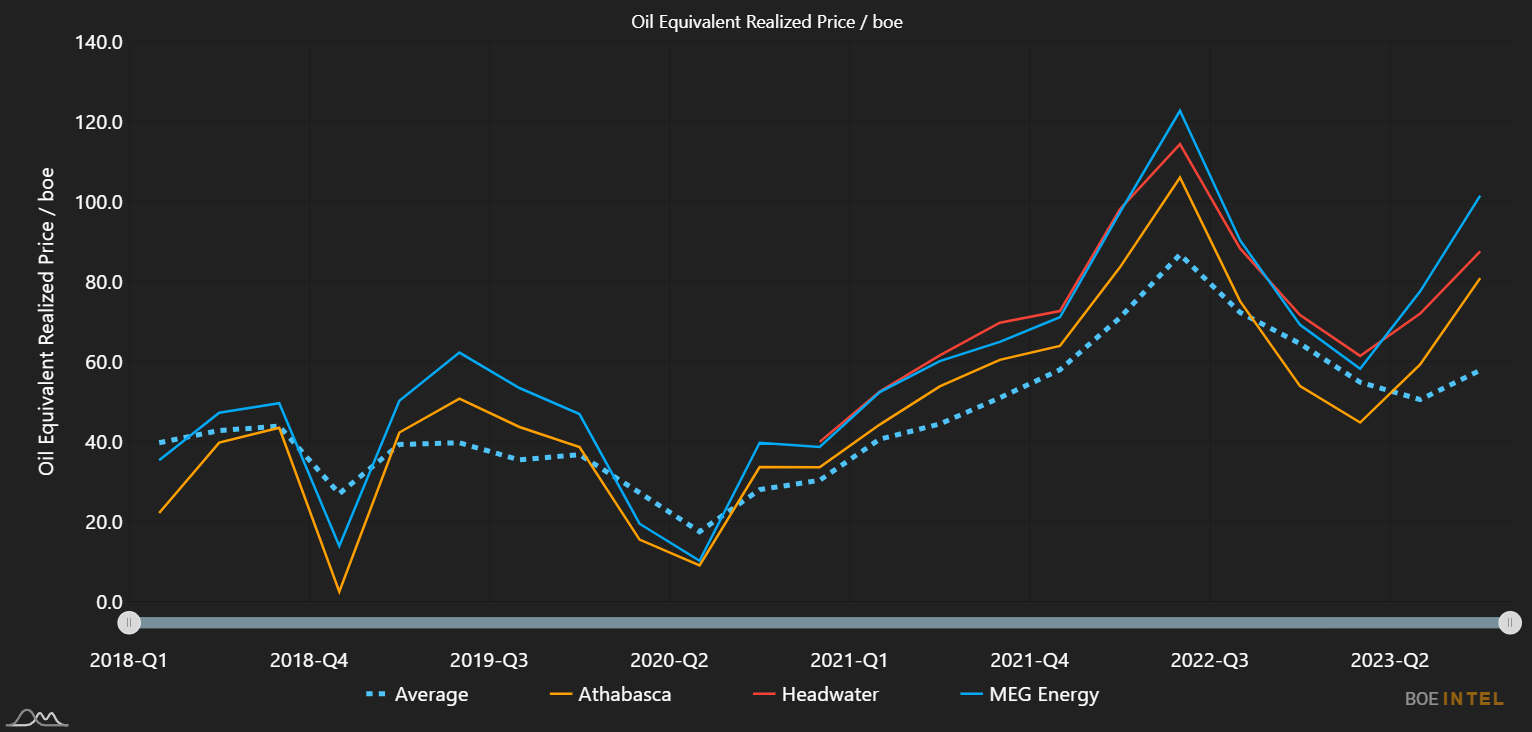
Realized Prices ($/BOE)
Realized pricing (mostly) improved for both oil and natural gas-weighted producers this quarter, and the average company saw a $6.91/BOE boost. Improvements in oil pricing were more pronounced, however, which helps make sense of the top performers below. Oil sands producer MEG Energy took advantage of greatly improved WTI pricing and WCS Heavy Oil differentials in Q3, as did Athabasca Oil. Headwater, which produced 93.8% heavy oil in Q3, capitalized on heavy oil realized pricing that improved from $77.14/BBL to $92.05/BBL. With a macro picture that has changed frequently in the past month, particularly with an OPEC+ meeting on the horizon, it will be interesting to see how realized pricing develops in Q4.
| Company | Q3 2023 ($/BOE) | Q2 ($/BOE) | Absolute Change ($/BOE) |
| MEG Energy | 101.47 | 77.54 | 23.93 |
| Athabasca | 80.85 | 59.25 | 21.60 |
| Headwater | 87.56 | 71.98 | 15.58 |
| Tamarack Valley | 80.22 | 65.66 | 14.56 |
| Hemisphere | 86.57 | 72.48 | 14.09 |
| Baytex | 80.34 | 66.82 | 13.52 |
| Cardinal Energy | 84.25 | 71.56 | 12.69 |
| Gear Energy | 81.67 | 69.10 | 12.57 |
| Rubellite | 84.31 | 72.88 | 11.43 |
| Strathcona | 77.55 | 66.16 | 11.39 |
| Average | 57.13 | 50.22 | 6.91 |
Netbacks (After Hedging)
Netbacks improved for most Canadian E&Ps, driven by improved realized pricing and cost structures. The average company in our dataset saw an improvement of $4.55/BOE compared to the second quarter. Unsurprisingly, Athabasca and MEG Energy were the top performers with respect to quarter-over-quarter netback improvements, driven by their greatly improved realized pricing outcomes. Athabasca, in particular, saw notable improvements in its operating, transporation and hedging cost outcomes. Tamarack Valley capitalized on these same oil price dynamics, adding in significant operating cost improvements that led to the company’s Q3 netback beating Q2 by $15.04/BOE. Hemisphere, another oil-weighted producer, saw netback improvements driven by improved realized pricing and operating cost structures.
| Company | Q3 2023 ($/BOE) | Q2 2023 ($/BOE) | Absolute Change ($/BOE) |
| Athabasca | 49.70 | 30.67 | 19.03 |
| MEG Energy | 58.64 | 42.38 | 16.26 |
| Tamarack Valley | 51.72 | 36.68 | 15.04 |
| Hemisphere | 55.59 | 41.72 | 13.87 |
| Cardinal Energy | 43.81 | 31.85 | 11.96 |
| Headwater | 58.80 | 46.88 | 11.92 |
| Baytex | 48.57 | 39.21 | 9.36 |
| Gear Energy | 46.08 | 36.98 | 9.10 |
| Ovintiv | 34.25 | 25.56 | 8.69 |
| Surge Energy | 45.30 | 36.61 | 8.69 |
| Average | 34.14 | 29.59 | 4.55 |

G&A Expenses
G&A expenses declined slightly in Q3, with the average company spending $0.13/BOE less compared to the second quarter. Ovintiv cut its G&A spending by over 50%, largely on account of reduced fees related to corporate transactions that were realized in the second quarter. Kiwetinohk saw per-BOE G&A decrease by $1.05/BOE, with the company referencing increased production as a primary driver. Rubellite’s G&A costs likely declined through economies of scale as well, although many of the granular drivers of G&A aren’t disclosed in Rubellite’s reporting; the company has a Management and Operating Services Agreement (“MSA”) in place with Perpetual Energy that comprises a large portion of its overall G&A cost structure.
| Company | Q3 2023 ($/BOE) | Q2 2023 ($/BOE) | Absolute Change ($/BOE) |
| Ovintiv | 2.05 | 4.34 | -2.29 |
| Kiwetinohk | 2.15 | 3.20 | -1.05 |
| Rubellite | 5.63 | 6.27 | -0.64 |
| InPlay Oil | 3.03 | 3.63 | -0.60 |
| Crescent Point | 1.01 | 1.59 | -0.58 |
| Journey | 1.80 | 2.38 | -0.58 |
| Hammerhead | 2.22 | 2.73 | -0.51 |
| Bonterra Energy | 2.30 | 2.73 | -0.43 |
| Saturn | 2.19 | 2.60 | -0.41 |
| Perpetual | 5.02 | 5.42 | -0.40 |
| Average | 3.03 | 3.16 | -0.13 |

That’s it for this earnings season, although it is important to remember that a lot will happen between now and when companies report their Q4 2023 results. For more data and analytical tools that can help you stay current, check out BOE Intel.