Generally speaking, the third quarter was positive for many in the Canadian oil patch. After Q2 saw production curtailments related to the Alberta Wildfires, Q3 was a period of normalization for exposed producers. In addition, favourable macro trends led to improved realized pricing for E&Ps across Canada. To summarize this earnings season, our team has put together another Earnings Season Report Card. We’ve changed our format for this quarter, focusing in on the top 10 performers in each category. BOE Intel subscribers will have access to the data for all companies. Part 1 will focus on production and financial metrics, while we will evaluate companies’ per barrel metrics in Part 2. To revisit prior quarters, check out the 2023 Earnings Season Report Cards from Q2 (Part 1 and Part 2) and Q1 (Part 1 and Part 2).
Liquids Production
In Q3 2023, the median company in our dataset saw liquids production increase by just over 2.3% compared to the second quarter. Even more notable, the entire top 10 by % change in liquids production saw production growth of over 10%. Baytex saw the strongest growth in Q3, driven largely by the incorporation of assets from its acquisition of Ranger Oil in late June 2023. For some additional context, Baytex’s US liquids production in Q2 2023 was 27,896 BBL/d compared to 74,024 BBL/d in Q3 2023, a 46,128 BBL/d difference. Hammerhead Energy, recently acquired by Crescent Point Energy, had an impressive Q3 that saw the company grow its liquids production by 22.8% quarter-over-quarter. Hammerhead’s growth was organic, with a drilling program highlighted by a 12-well North Karr pad at 10-14 brought on stream in August that supplemented two 7-well pads in Gold Creek and North Karr. MEG Energy also grew its production notably, referencing its “focus on short-cycle redevelopment programs, enhanced completion designs, optimized well spacing and targeted facility enhancements” in its Q3 2023 MD&A. MEG also benefitted on the quarterly comparison by turnaround impacted Q2 production.
| Company | Q3 2023 (BBL/d) | Q2 2023 (BBL/d) | Absolute Change (BBL/d) | % Change |
| Baytex | 128,971 | 76,763 | 52,208 | 68.0 |
| Hammerhead | 22,039 | 17,950 | 4,089 | 22.8 |
| Canadian Natural Resources | 1,035,153 | 846,909 | 188,244 | 22.2 |
| MEG Energy | 103,726 | 85,974 | 17,752 | 20.6 |
| Advantage Energy | 7,577 | 6,355 | 1,222 | 19.2 |
| NuVista | 33,195 | 28,267 | 4,928 | 17.4 |
| Enerplus | 66,625 | 58,214 | 8,411 | 14.4 |
| Pine Cliff | 2,872 | 2,527 | 345 | 13.7 |
| Crescent Point | 136,632 | 120,258 | 16,374 | 13.6 |
| Paramount | 44,788 | 39,878 | 4,910 | 12.3 |
| Median | 20,847 | 20,387 | 460 | 2.3 |
Figure 1 – Baytex quarterly production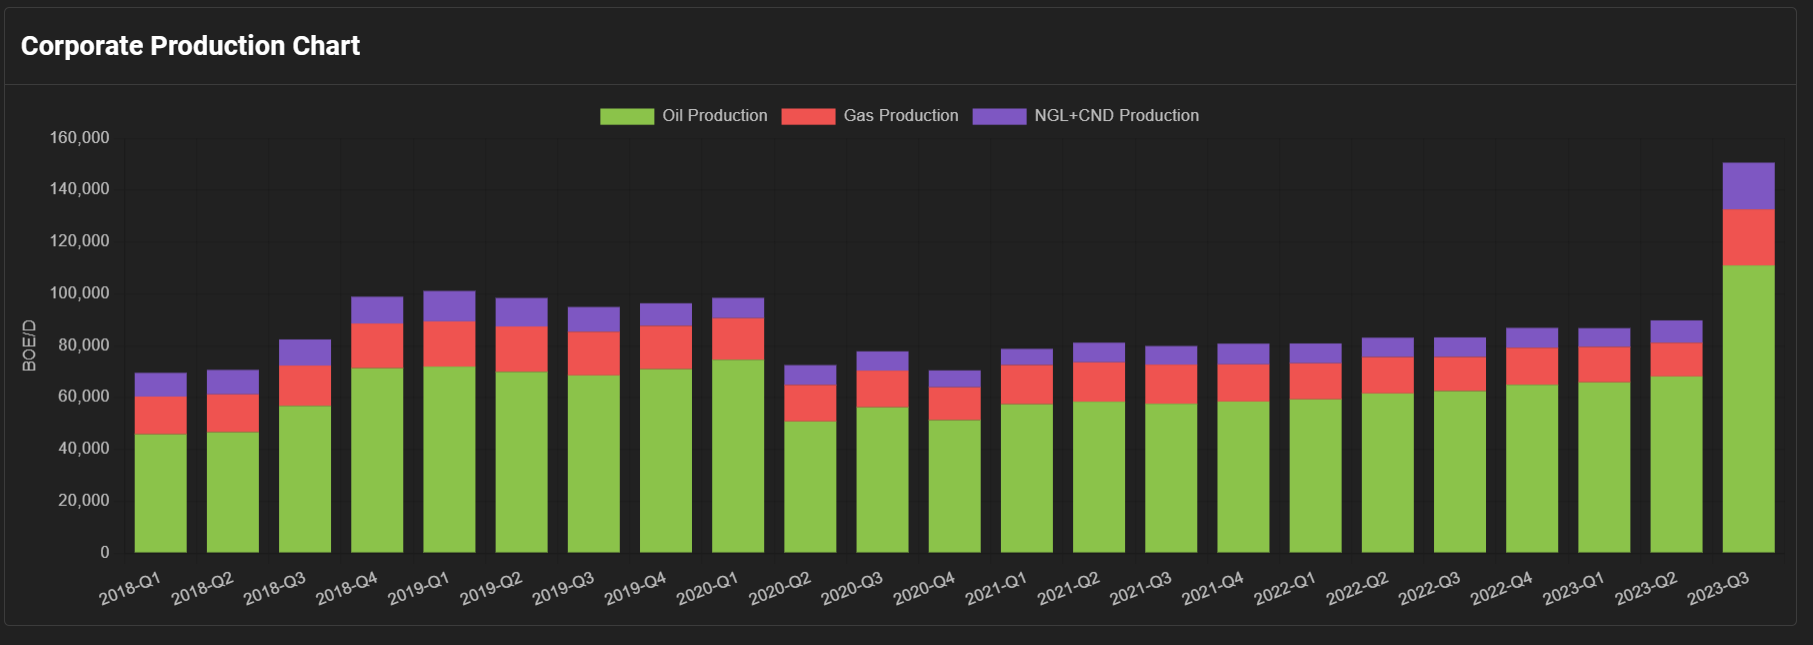
Natural Gas Production
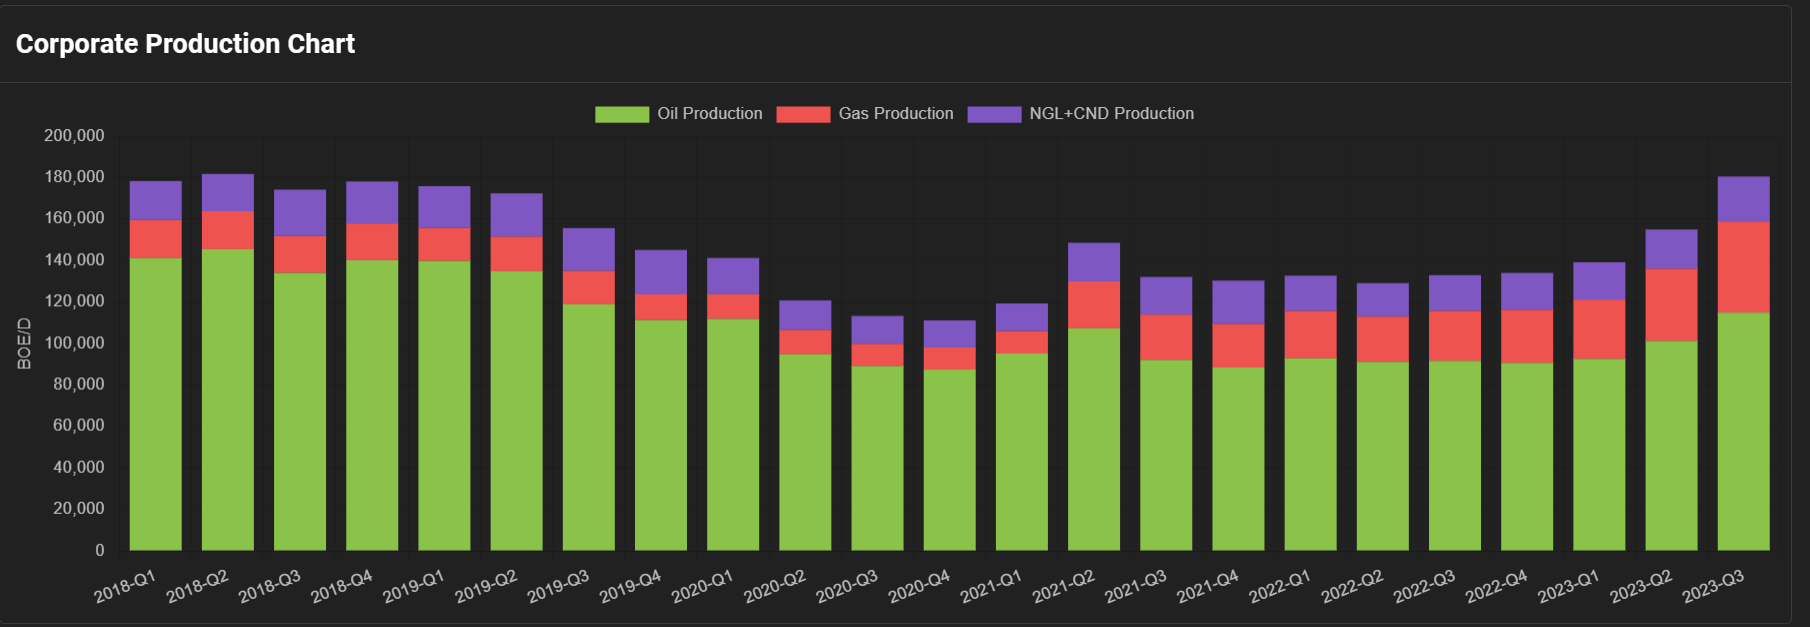
The median company in our dataset saw an 8.7% increase in natural gas production. Crescent Point grew its natural gas production by 26.4%, likely driven in no small part by the company’s Q2 and Q3 2023 drilling activity at Gold Creek and Karr (Access a Petro Ninja list of the Crescent Point’s wells in Karr and Gold Creek that have gone on production since April 1 2023 here). Advantage Energy also gained big this quarter, eclipsing its Q2 production levels by 24.5%. This was driven by strong well performance at Glacier, where the last eighteen wells put on production delivered an average IP30 of 13.6 MMcf/d. Advantage’s quarter-over-quarter comparison also benefitted from Q2 production being impacted by wildfires and a turnaround at its Glacier Gas Plant. Cenovus, despite being almost 75% oil by daily average production in Q3, also saw significant natural gas production growth. This was due, in part, to a normalization of the company’s Northern Corridor operations following a wildfire impacted Q2. This is reflective across most companies in the top 10; the Grand Prairie areas of the Montney play were among the province’s most impacted by wildfire curtailments, and every company in the top 10 below except for Baytex and Saturn were heavily exposed to these hazards.
| Company | Q3 (mmcf/d) | Q2 (mmcf/d) | Change (mmcf/d) | % Change |
| Baytex | 129.8 | 78.0 | 51.8 | 66.4 |
| Crescent Point | 263.7 | 208.6 | 55.1 | 26.4 |
| Advantage Energy | 339.7 | 272.9 | 66.8 | 24.5 |
| Cenovus | 867.4 | 729.4 | 138.0 | 18.9 |
| Hammerhead | 144.0 | 126.3 | 17.7 | 14.0 |
| Paramount | 323.1 | 290.2 | 32.9 | 11.3 |
| Strathcona | 120.4 | 108.6 | 11.8 | 10.8 |
| NuVista | 283.1 | 256.6 | 26.5 | 10.3 |
| Whitecap | 323.9 | 294.4 | 29.5 | 10.0 |
| Saturn | 29.1 | 26.6 | 2.5 | 9.5 |
| Median | 127.8 | 117.5 | 10.3 | 8.7 |
Figure 2 – Crescent Point quarterly production
Operating Cash Flow
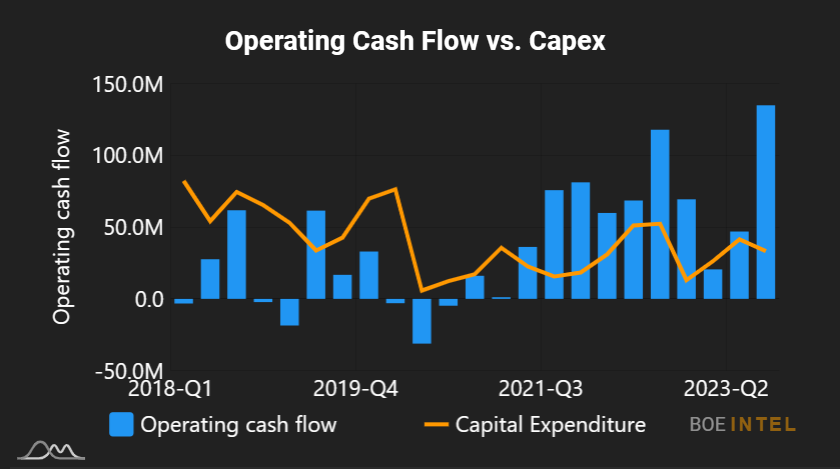
The third quarter was a bounce back period when it comes to cash generation in the oil patch, after depressed commodity prices and wildfire curtailments resulted in a somewhat muted Q2. This impact was realized by both oil- and gas-weighted producers with assets across Alberta, BC and Saskatchewan. The median company in our dataset saw a 20.7% increase in operating cash flow compared to the second quarter. Athabasca Oil led all producers with a 187.5% increase, underpinned by an increase in global oil prices and an accompanying decrease in WCS heavy oil differentials. Between this strong quarter and the company’s closed sale of its non-core light oil assets for $160 million, it will be interesting to see how the company deploys its capital in Q4 and 2024. Advantage Energy also saw a significant increase in cash flow, more than doubling its second quarter numbers on account of improved natural gas pricing and increased overall production. InPlay Oil also impressed, benefitting from improved realized pricing and increased average production volumes.
| Company | Q3 ($) | Q2 ($) | Absolute Change ($) | % Change |
| Athabasca | 134,879,000 | 46,914,000 | 87,965,000 | 187.5 |
| Advantage Energy | 90,376,000 | 37,966,000 | 52,410,000 | 138.0 |
| Baytex | 444,033,000 | 192,308,000 | 251,725,000 | 130.9 |
| InPlay Oil | 24,242,000 | 13,351,000 | 10,891,000 | 81.6 |
| Hammerhead | 122,047,000 | 75,855,000 | 46,192,000 | 60.9 |
| Kiwetinohk | 60,294,000 | 41,360,000 | 18,934,000 | 45.8 |
| Petrus Resources | 18,867,000 | 12,957,000 | 5,910,000 | 45.6 |
| Crescent Point | 648,900,000 | 462,100,000 | 186,800,000 | 40.4 |
| Cenovus | 2,738,000,000 | 1,990,000,000 | 748,000,000 | 37.6 |
| MEG Energy | 332,000,000 | 244,000,000 | 88,000,000 | 36.1 |
| Median | 87,972,000 | 72,903,500 | 15,068,500 | 20.7 |
Figure 3 – Athabasca quarterly operating cash flow vs. capex
Net Debt
As we’ve pointed out in previous earnings season report cards, net debt going up or down doesn’t necessarily come with associated connotations. Often times an increase in net debt from low levels may be setting the stage for future growth, while decreases in net debt from extended levels will usually be viewed positively. Overall, we evaluated 13 companies that decreased their net debt while the remainder of the companies in our dataset saw it rise. While Tourmaline saw the largest increase to net debt by dollar amount, it was very minor in the capital structure of the company or on a percentage basis. The company likely grew net debt levels further with the acquisition of Bonavista Energy Corporation, announced on October 16. Nevertheless, net debt to trailing 12 months operating cash flow remained a miniscule 0.2x after Q3 results (Figure 4 below). Crew Energy, which has actively pursued organic growth in recent years, increased its net debt by almost $64 million in the third quarter. In explaining this increase, the company cited “significant investment in drilling, completion and infrastructure projects” in its Q3 MD&A. On the other end of the table, some of the industry’s largest producers decreased their leverage significantly during this quarter. CNRL and Cenovus led the pack, with net debt decreases of $514 and $391 million respectively. Cenovus, as an example, referenced its repurchase of US$1 billion in notes in the third quarter, reducing its annual interest expense by $83 million. As has been the case throughout the year, companies across the industry have drawn closer to their target net debt ranges; it will be interesting to see how capital allocation shakes out in the fourth quarter.
| Company | Q3 2023 ($) | Q2 2023 ($) | Absolute Change ($) |
| Top 5 | |||
| Tourmaline | 879,799,000 | 791,131,000 | 88,668,000 |
| Crew Energy | 124,578,000 | 60,688,000 | 63,890,000 |
| Birchcliff | 327,655,000 | 278,521,000 | 49,134,000 |
| Paramount | 44,400,000 | 2,300,000 | 42,100,000 |
| Kelt Exploration | 15,917,000 | -18,580,000 | 34,497,000 |
| Bottom 5 | |||
| Whitecap | 1,260,200,000 | 1,361,200,000 | -101,000,000 |
| MEG Energy | 1,198,000,000 | 1,316,000,000 | -118,000,000 |
| Tamarack Valley | 1,128,030,000 | 1,373,620,000 | -245,590,000 |
| Cenovus | 5,976,000,000 | 6,367,000,000 | -391,000,000 |
| Canadian Natural Resources | 11,519,000,000 | 12,033,000,000 | -514,000,000 |
Figure 4 – Tourmaline net debt to trailing 12 months operating cash flow

To access this data for all companies, check out BOE Intel. For our part, we’ll be releasing Part 2 of this analysis, focused on per-barrel metrics, in the near future.
EDITOR’S NOTE: The liquids production table was re-ordered shortly after publishing.