We have put out a couple of pieces over the last 9 months detailing the consolidation of the Montney:
- In BC, where the top 5 licensees account for 78% of BC Montney volumes.
- In AB, where the top 5 licensees account for 66% of AB Montney volumes.
But what are Montney molecules worth? The table below shows the larger M&A deals since 2022 where substantial Montney volumes were involved as part of the transactions. The average flowing barrel multiple for these transaction has been ~$44,000/BOE/d (see how this compares to Permian transactions here). Obviously there is much more that goes into the valuation of an asset/company than just a price per BOE/d of production, but this is a simple starting point. None of this is investment advice of course, purely just an interesting look at the data from BOE Intel.
Figure 1 – Recent M&A transactions involving substantial Montney volumes (turn phone sideways to view table on mobile)
| Date | Type | Acquirer | Target | Value ($) | Region/Play | BOE/d | % liquids | $/BOE/d |
|---|---|---|---|---|---|---|---|---|
| 2025-03-10 | Corporate | Whitecap Resources | Veren | 8,500,000,000 | AB Montney/Duvernay | 192,000 | 65 | 44,271 |
| 2024-11-14 | Asset | Ovintiv | Paramount Resources | 3,325,000,000 | AB Montney | 70,000 | 50 | 47,500 |
| 2024-08-12 | Corporate | Tourmaline Oil Corp. | Crew Energy | 1,300,000,000 | BC Montney | 29,500 | 29 | 44,068 |
| 2023-11-06 | Corporate | Crescent Point | Hammerhead Energy | 2,550,000,000 | Alberta Montney | 56,000 | 48 | 45,536 |
| 2023-08-01 | Corporate | Strathcona Resources | Pipestone Energy Corp. | 920,000,000 | Montney | 33,143 | 41 | 27,759 |
| 2023-03-28 | Asset | Crescent Point | Spartan Delta Corp. | 1,700,000,000 | Alberta/Montney | 38,000 | 55 | 44,737 |
| 2022-06-28 | Corporate | Whitecap Resources | XTO Energy Canada | 1,700,000,000 | Montney/Duvernay | 32,000 | 30 | 53,125 |
**BC transactions highlighted in green – AB in black
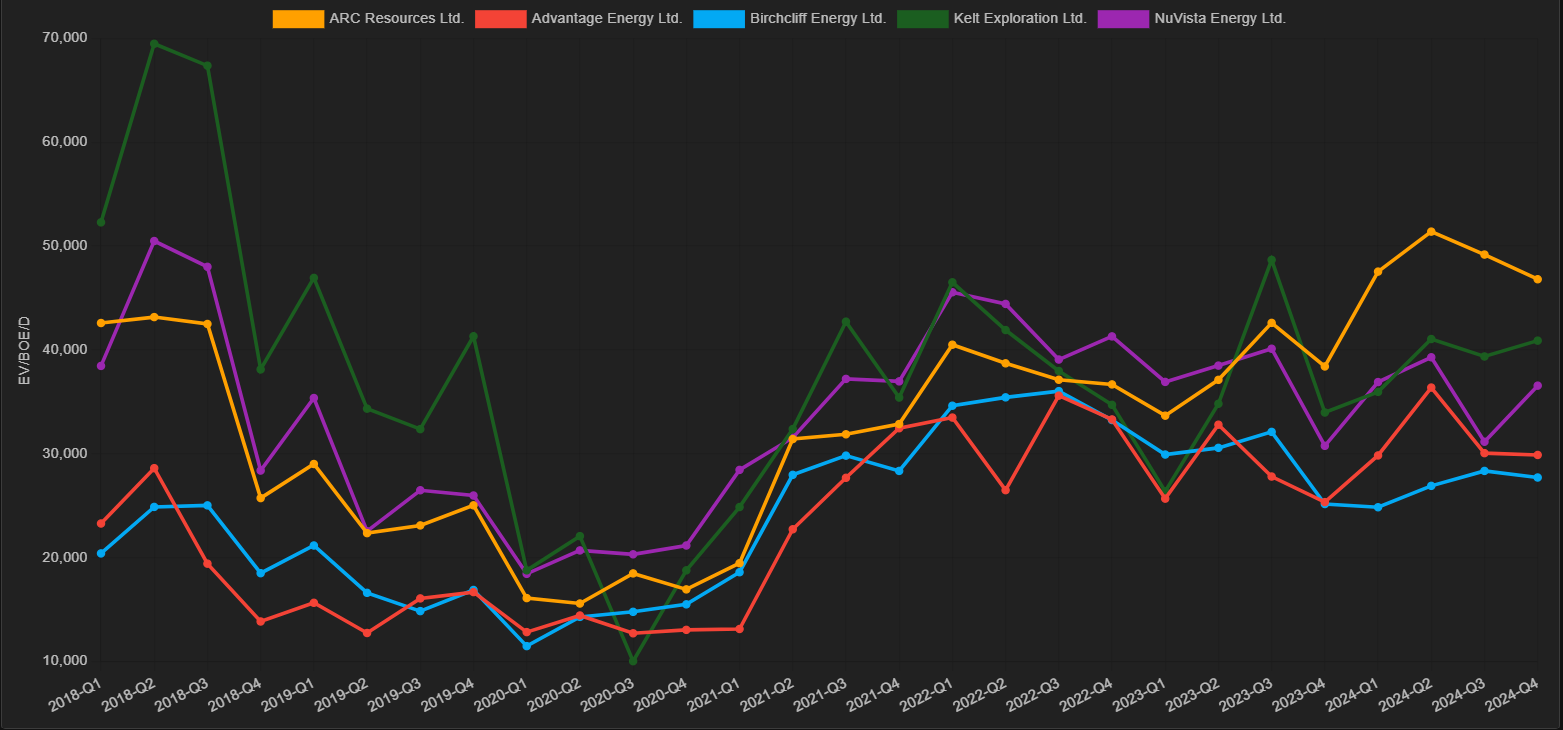
Now let’s take a look at the flowing barrel trading multiples for a few publicly traded companies with significant Montney exposure, and what that might mean for each company. ARC Resources, Advantage Energy, Birchcliff Energy, Kelt Exploration, and NuVista are shown below in Figures 2-4. We’ve classified the companies into 3 groups…purely for fun of course:
- Premium multiple – Trading at flowing barrel metrics above average Montney M&A transaction – in theory could support accretive acquisitions or could continue business as usual with the market supporting the valuation.
- Mid multiple – Trading generally in-line to slightly below average Montney M&A transaction multiples – what’s next?
- Low multiple – Flowing barrel metrics are low – companies potentially looking for ways to boost valuation.
Premium multiple – ARC Resources
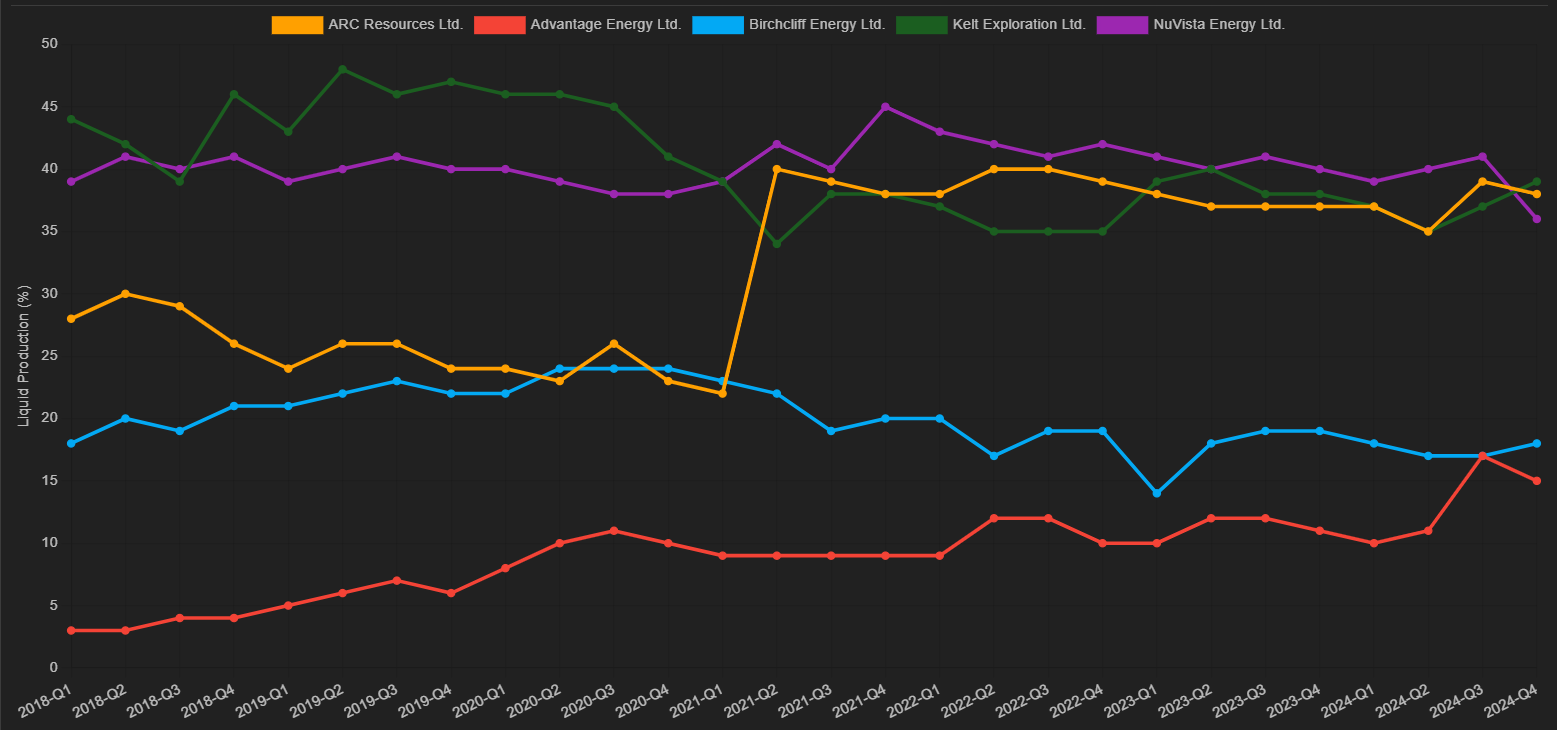
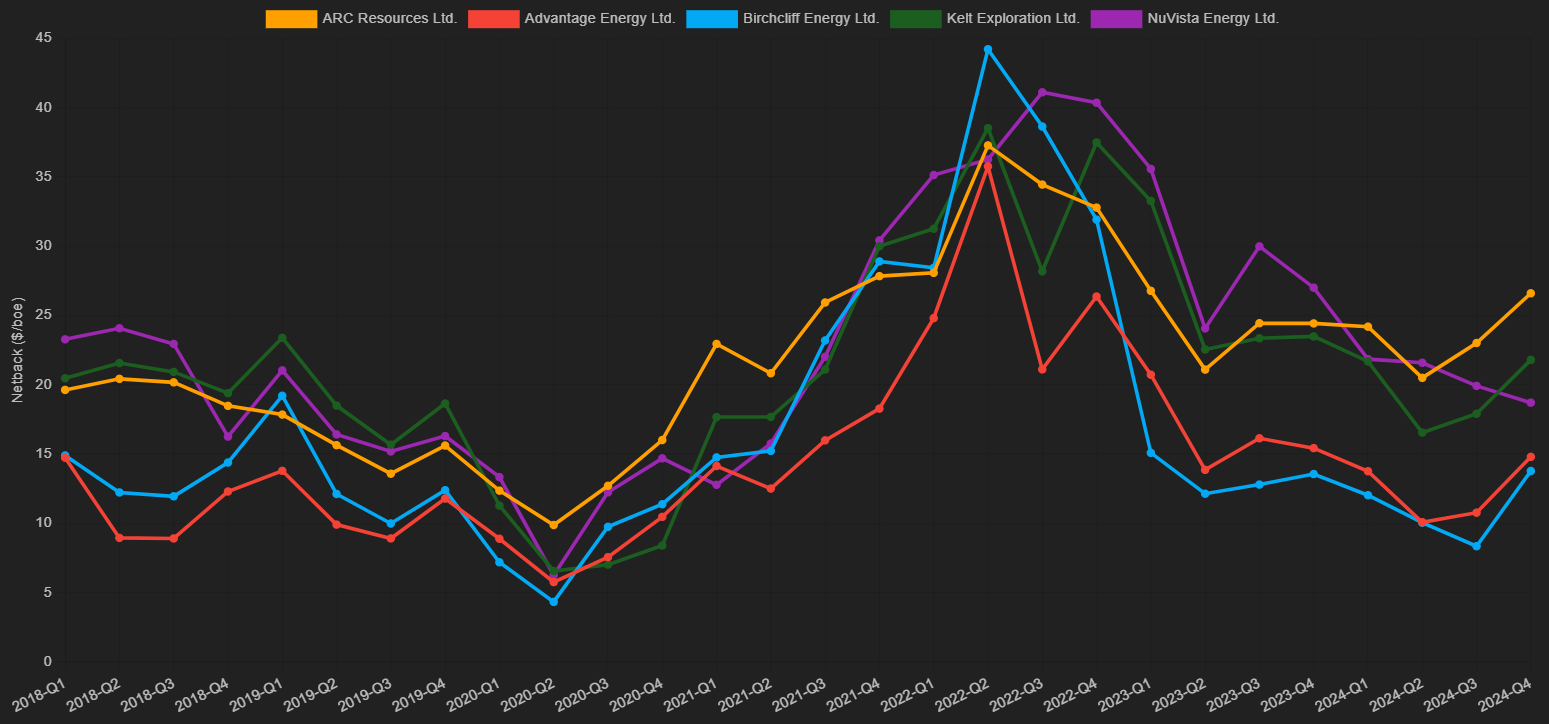
ARC is clearly the premium multiple name in Figure 2, although interestingly it wasn’t always the case if you look back in time at the graph. One could argue that the Seven Generations acquisition was enormous in that it gave the company the size and scale (as well as condensate exposure) to become that premium multiple name. Also note the jump in Liquids % (Figure 3) as a result of the acquisition. Not surprisingly this led to a higher netback profile (from 3rd to 1st)….with higher netbacks generally equating to a higher flowing barrel multiple. ARC has also firmly cemented itself into the LNG discussion, by signing significant offtake agreements, and added to its growth profile by sanctioning Attachie Phase 1 back in 2023.
Mid Multiple – Kelt Exploration, NuVista Energy
Kelt and NuVista are interesting here. Both good liquids content, reasonable operating netbacks, and yet both trade slightly below that average flowing barrel metric that we have seen with Montney M&A. What’s next?
Low Multiple – Birchcliff Energy, Advantage Energy
Birchcliff and Advantage are in a different position than the other Montney companies shown here. A significantly lower liquids percentage from the drier parts of the Montney (Figure 3) has resulted in lower operating netbacks (Figure 4) and lower flowing barrel valuation metrics. Advantage has sought to increase liquids content and netback profile with the Longshore acquisition, but now has Kimmeridge as an activist looking for other strategic ideas including setting up a “special committee to study a possible sale of the company.”
Will LNG Canada exports begin in time to save Canadian natural gas prices and rescue the netbacks/valuations, or are more strategic ideas needed?
Figure 2 – EV/BOE/d ($) – BOE Intel

*Most recent data point is from Q4 2024. See company page on BOE Intel for up to date metrics.
Figure 3 – Liquids % – BOE Intel

Figure 4 – Operating Netback (after hedging) – BOE Intel
