• Sign up for the Daily Digest E-mail
  • Facebook
  • Twitter
  • LinkedIn

BOE Report

Sign up
  • Home
  • BOE Intel
  • Headlines
    • Latest Headlines
    • Featured Companies
    • Columns
    • Discussions
  • Well Activity
    • Well Licences
    • Well Activity Map
  • Property Listings
  • Land Sales
  • M&A Activity
    • M&A Database
    • AER Transfers
  • Markets
  • Rig Counts/Data
    • CAOEC Rig Count
    • Baker Hughes Rig Count
    • USA Rig Count
    • Data
      • Canada Oil Market Data
      • Canada NG Market Data
      • USA Market Data
      • Data Downloads
  • Jobs

Woodland Development Corp. revealed as the buyer of Vermilion’s southeast Saskatchewan assets – BOE Intel

May 4, 20237:20 AM Dan Rutherford

About a month ago, Vermilion Energy indicated that its disposition of some non-core SE Saskatchewan assets had closed. Vermilion indicated that proceeds received were about $225 MM, with associated light oil production of about 5,500 boe/d. At the time, no mention was made as to who the buyer of the assets was.

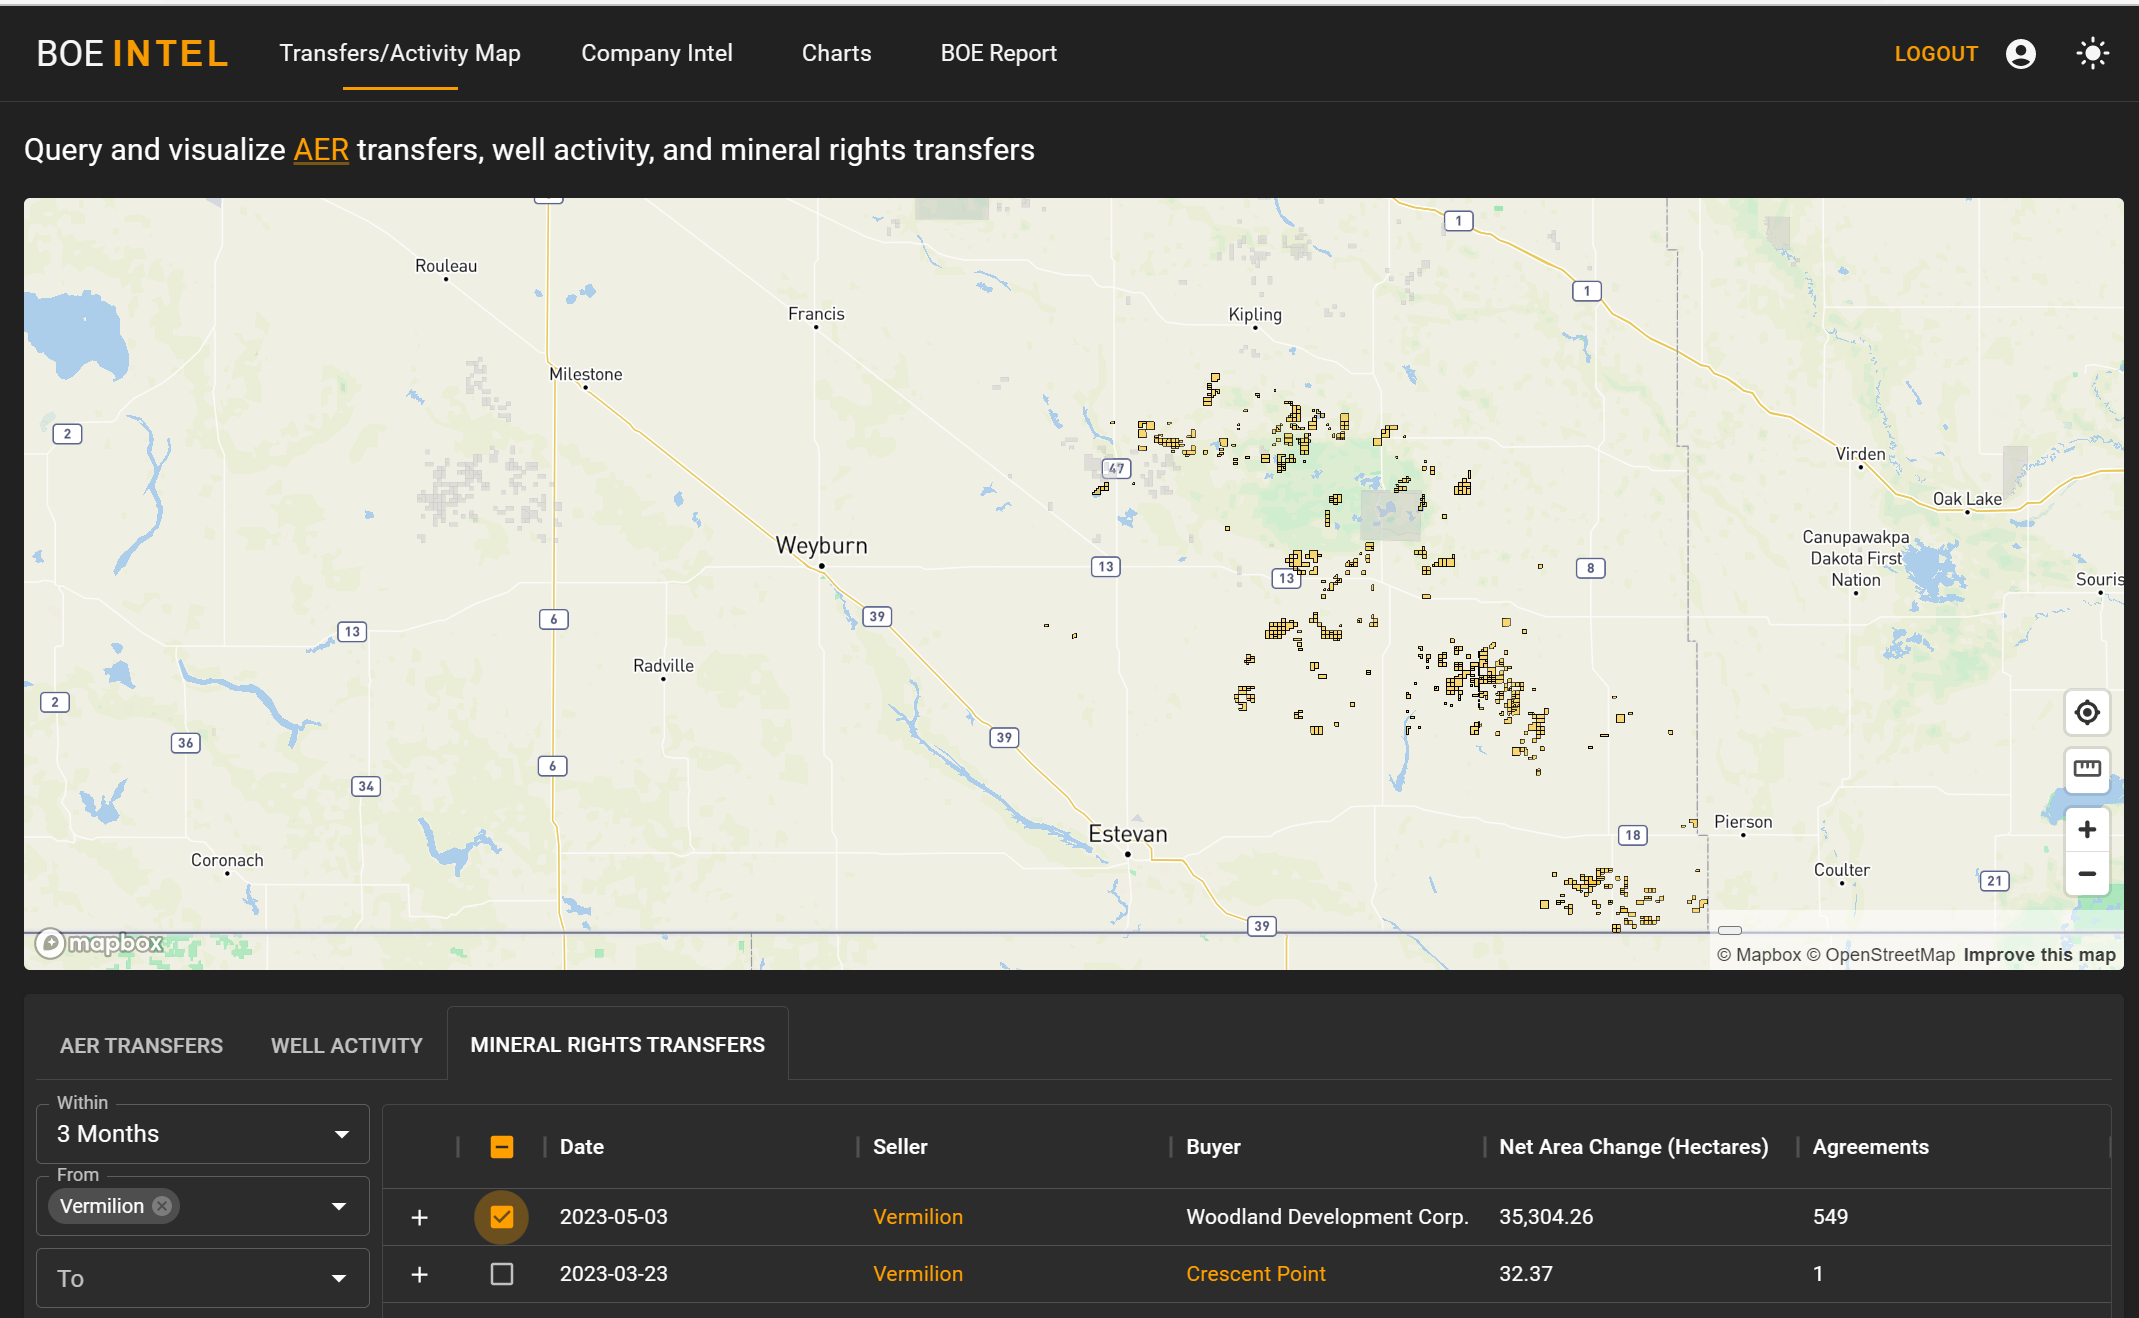
Thanks to our mineral rights transfer tool at BOE Intel, we can officially see the buyer of record and the associated land position as the mineral rights transfer has gone through today. The buyer is Woodland Development Corp., “a private light oil and gas exploration and development company focused on the conventional oil and gas reservoirs of SE Saskatchewan”, as per the company’s website. While it’s possible that more mineral rights will get transferred over time, the initial transfer that we can see comprises a substantial 35,304 net hectares of land.

Woodland appears to be a new company, at least partially funded by Saskatchewan private equity firm PFM Capital.

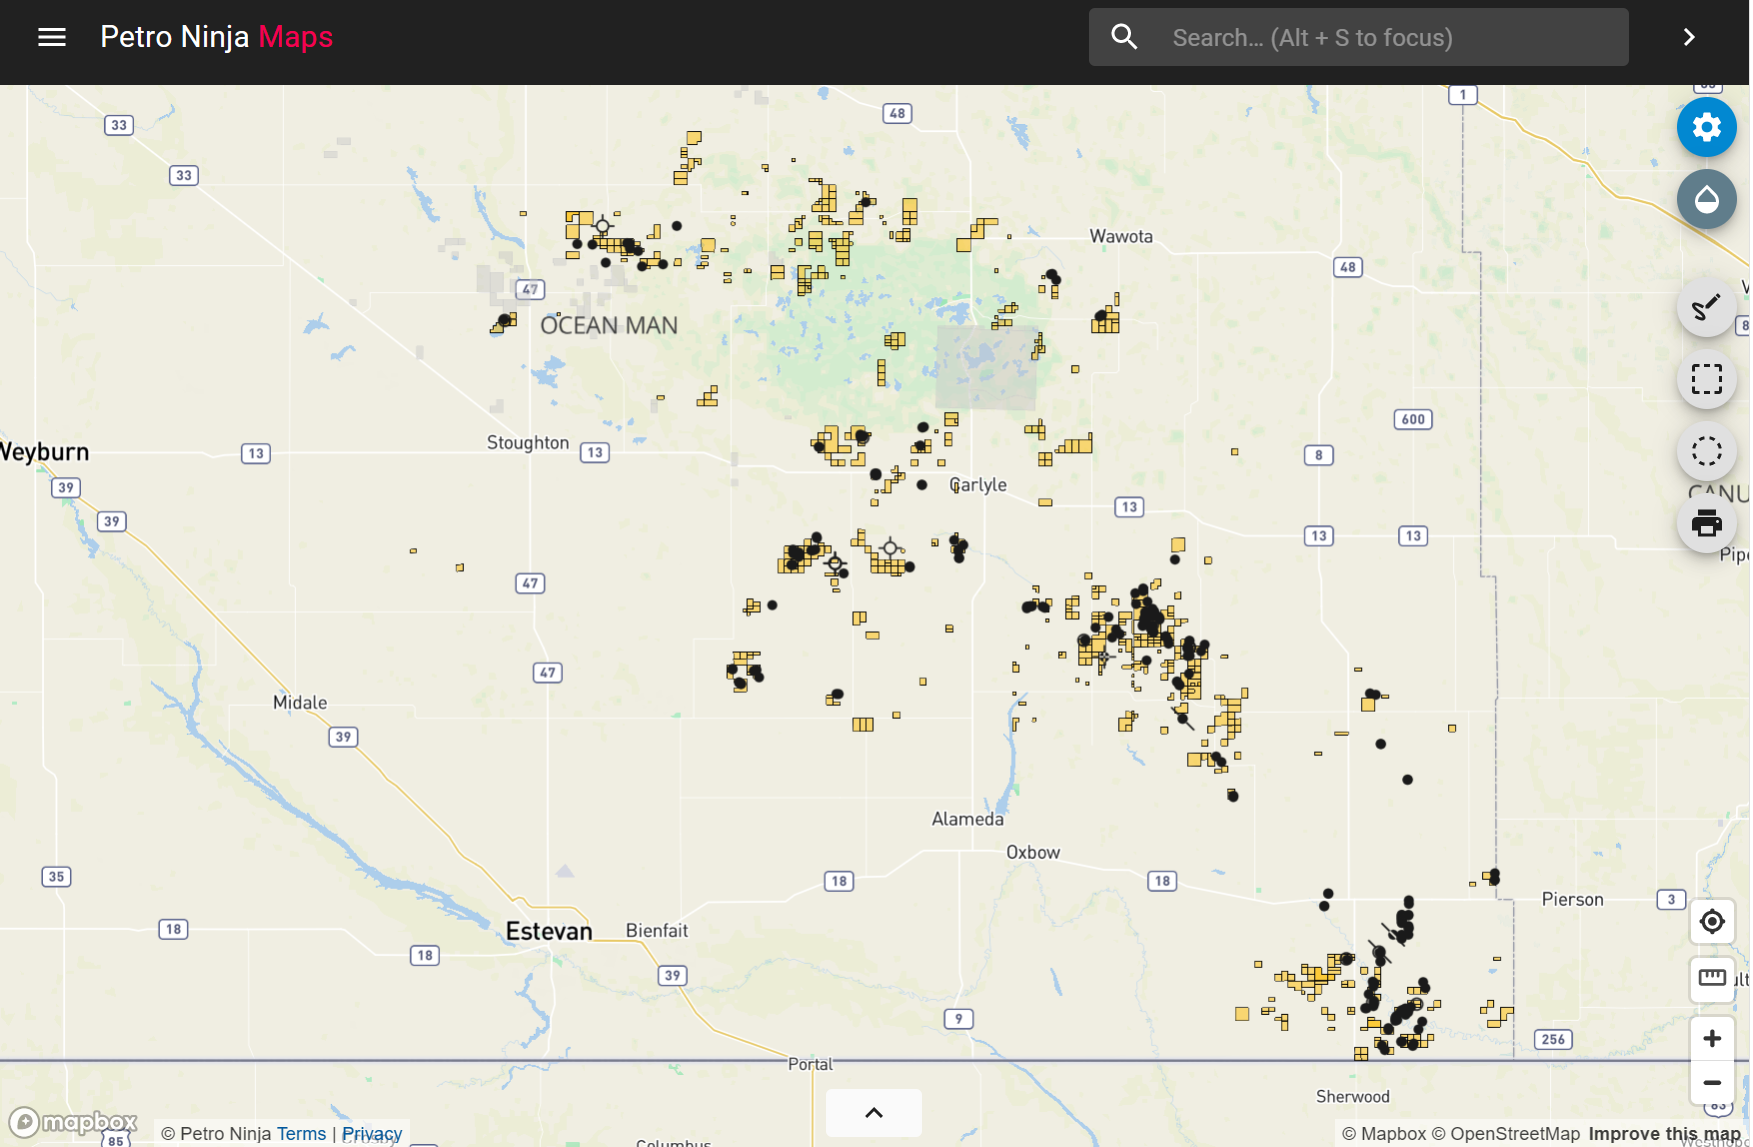
Using Petro Ninja maps, we can see 234 wells drilled since the beginning of 2018 where Woodland is now the licensee. Those wells are shown below in black, with Woodland crown mineral rights shown in yellow. Click on the map to see that list of wells.

If we filter out the wells that aren’t showing any production in the last month, we get a list of 139 wells. Petro Ninja can give us an average of these wells, which is shown below as the grey line, alongside the 5 best wells from that selection. This is an interactive chart, so hovering over the wells will allow you to see the production profile of those top producing wells.


This analysis used tools from BOE Intel and Petro Ninja. Reach out here if you would like to book a demo for you and your company.

Vermilion Energy

Follow BOE Report
  • Facebook
  • Twitter
  • LinkedIn

Sign up for the BOE Report Daily Digest E-mail

Successfully subscribed

Latest Headlines
  • Week in Review – Stock gainers/fallers and most read articles
  • ROK Resources files financial results and management discussion & analysis for the first quarter of 2023
  • Suncor Energy provides update on acquisition of TotalEnergies’ Canadian operations
  • US oil & gas rigs fall in May by most in a month since 2020
  • Headwater Exploration achieves record gross licensed production in April – BOE Intel

Return to Home
Alberta GasMonthly Avg.
CAD/GJ
Market Data by TradingView

    Report Error


    Note: The page you are currently on will be sent with your report. If this report is about a different page, please specify.

    About
    • About BOEReport.com
    • In the News
    • Terms of Use
    • Privacy Policy
    • Editorial Policy
    Resources
    • App
    • Widgets
    • Notifications
    • Daily Digest E-mail
    Get In Touch
    • Advertise
    • Post a Job
    • Contribute
    • Contact
    • Report Error
    Featured In
    • CamTrader
    • Rigger Talk
    Data Partner
    BOE Network
    © 2023 Stack Technologies Ltd.