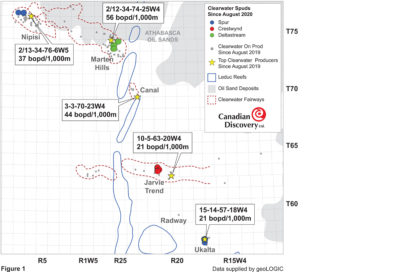
As industry continues to endure the chaos of the last six months (not that the last six years have been much of a picnic…), activity is slowly returning to key plays like the Clearwater. Outside of thermal development wells at Cold Lake, the Clearwater went undrilled from early March to mid-August 2020. However, new wells have since been spudded at Nipisi, Marten Hills, Meanook (on the Jarvie trend) and Ukalta (figure 1). Since multi-lateral Clearwater production volumes and rates account [Read more]
The Dunvegan: Uphole Potential?
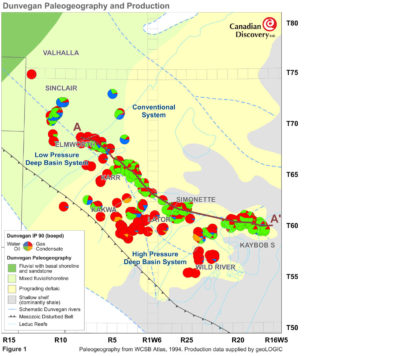
As operators look to maximize returns on their existing properties, or to invest in new opportunities, they often look “uphole” to shallower productive zones. The Upper Cretaceous Dunvegan Formation fits that bill in the Deep Basin of west-central Alberta. The Dunvegan was deposited in a fluvial-deltaic environment (figure 1) on the scale of the present day Mississippi Delta. Figure 2 is a cross-section that traverses one of the Dunvegan delta’s larger distributary channels and shows the facies [Read more]
Productivity factors in the Clearwater oil play
Clearwater oil production continues to accelerate with an increase of over 23,000 bopd in the last few years. Production comes from three main areas—Marten Hills, Nipisi and Jarvie—along with smaller fields such as Gift, Canal and Cadotte (figure 1). The Clearwater is complex, and understanding the variations and interplay of oil and reservoir quality oil is important to ensure strong productivity as the play progresses. The key productivity factors include reservoir quality, oil quality [Read more]
The Marten Hills Clearwater Oil Play: Robust Economics
Snappy Payouts and Returns In its short four-year life, the Clearwater cold flow heavy oil play at Marten Hills, Nipisi and Jarvie has gone from interesting land sales to producing 18,400 bopd (as of Sep 2019) (figure 1). Over 8 mmbo have been produced to September 2019. The main players are Spur and Deltastream, with Highwood, Cenovus and CNRL also active. The strong economics of each of the three main areas are key to the success of this play, though there are definite differences [Read more]
Quenching Thirst in the Duvernay
The Duvernay is a Thirst Trap About 23 million cubic meters (m3) of water was used for fraccing in Alberta in 2017 (AER, 2018), and nearly 99% of that volume was non-saline. Within the Duvernay fairway (figure 1), the Spirit River has been the most drilled zone by well count, followed by the Cardium and the Duvernay. Though it has fewer wells, the Duvernay far exceeds the Spirit River and Cardium in terms of total volume of water pumped (figure 2). In 2017, 8.6 million m3 was pumped into the [Read more]
The Marten Hills Clearwater Oil Play: From Open Land to High Demand
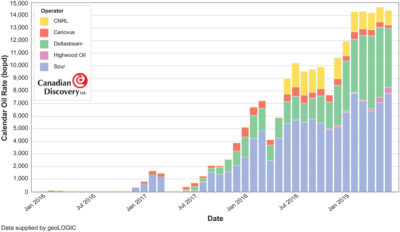
In four short years, the Clearwater cold flow heavy oil play at Marten Hills and Nipisi has gone from interesting land sales to producing over 14,000 bopd. Over 6 mmbo have been produced to mid-July 2019. The main players are Spur and Deltastream, with Highwood, Cenovus and CNRL also active (map). A timeline shows the interplay of drilling activity and land sales, while a graph shows that oil rates went from almost zero in late 2016 to over 14,000 bopd in mid-2019. The potential size of the [Read more]
Montney Hydrodynamics – Key to Unlocking the Play
The Montney has become, by far, the largest contributor to new gas and now contributes 34% of WCSB gas production (approximately 7 bcf/d). Perhaps more importantly, liquids production from the Montney (oil, condensate and NGLs) has risen from 70,000 to 150,000 bopd, significantly changing the economics of the play. Since Canadian Discovery Ltd.’s (CDL) 2014 Montney Hydrodynamics Study release, over 3,500 new wells have been completed in the Montney and significant new production fairways are [Read more]
Can the Montney WGI Be a Ouija Board for Gas Liquids?
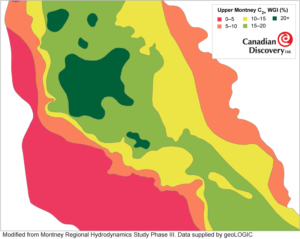
Wet Gas Index as a Proxy for Liquids Richness? In this era of under-reported or unreported gas liquids production, could the Ethane+ also known as the C2+ Wet Gas Index (WGI) serve as a proxy to indicate liquids richness? The C2+ WGI could be useful as there are often more wells with gas analyses than with reported liquids production. To explore this idea, Upper Montney C2+ WGI values are compared with the condensate-gas ratio (CGR) and IP90 oil rates from Upper Montney producers. The C2+ [Read more]
Canadian Discovery Completes 3rd Phase of Montney Hydrodynamics Study
Canadian Discovery Ltd. (CDL) examines the relationships between pressure, temperature and hydrocarbon fluid chemistry in the Montney reservoir. CDL’s established work flow and quality data analysis of these key attributes provides critical insights for existing and future acreage holders. To learn more about CDL’s Montney Hydrodynamics Phase III study, visit canadiandiscovery.com. Canadian Discovery Ltd. 622 – 5 Avenue SW, Calgary AB T 403.269.3644 info@canadiandiscovery.com [Read more]
Will South Duvernay Oil Rates at Pembina Soar Like Cygnet?
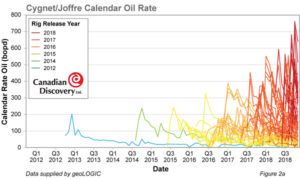
Will Oil Rates in the WSB South Duvernay Oil Play Ramp Up? The Duvernay South Oil play in the Pembina/Bigoray area in the West Shale Basin is in its infancy (figure 1). Resource play development often follows a pattern of increasing rates in the early stages as operators refine completions strategies; flattening rates in the middle years; and then declining rates as the play moves out of sweet spots and into more fringe acreage (Lenko and Xie, 2018). Cygnet Soars! Figures 2a-c show [Read more]