In Part 2 of the Q1 2023 Earnings Season Report Card, we focus on costs, netback, and realized pricing. Using our dataset of over 40 public Canadian E&P companies, we’ve performed an assessment on how companies fared in Q1 2023 in comparison to the previous quarter. In general, costs remain elevated and netbacks took a hit on account of depressed commodities pricing in Q1 2023. You can revisit our analysis of production, cash flow, and net debt in Part 1. And for a refresher on Q4 2022, check out our last Earnings Season Report Card.
Operating Costs
Operating costs moderated in Q1 2023, as producers saw a slight reprieve from the run of increases observed through much of 2022. Of the companies with operating costs available for each quarter, 23 companies saw increased operating costs compared to Q4 2022 while 18 companies saw decreased operating costs. The median firm saw a 1.9% decrease in operating costs, as producers continue to carefully watch inflationary inputs. The best quarter-over-quarter improvement on operating costs was Journey, which reduced operating costs by 17.6%. In the company’s Q4 2022 report, Journey indicated that operating costs were elevated on account of an acquisition that closed in October 2022, well reactivations, and third party turnarounds; the observed reduction in operating costs in Q1 2023 may suggest that these pressures are ameliorating. Hammerhead was another strong performer, with costs that declined by 15.9% quarter-over-quarter. Hammerhead Energy greatly increased quarter-over-quarter production and is likely benefitting from economies of scale. CNRL also reduced operating costs by almost 11%. The bulk of this decrease appears to be tied to significant efficiencies in its North Sea and Offshore Africa oil operations.
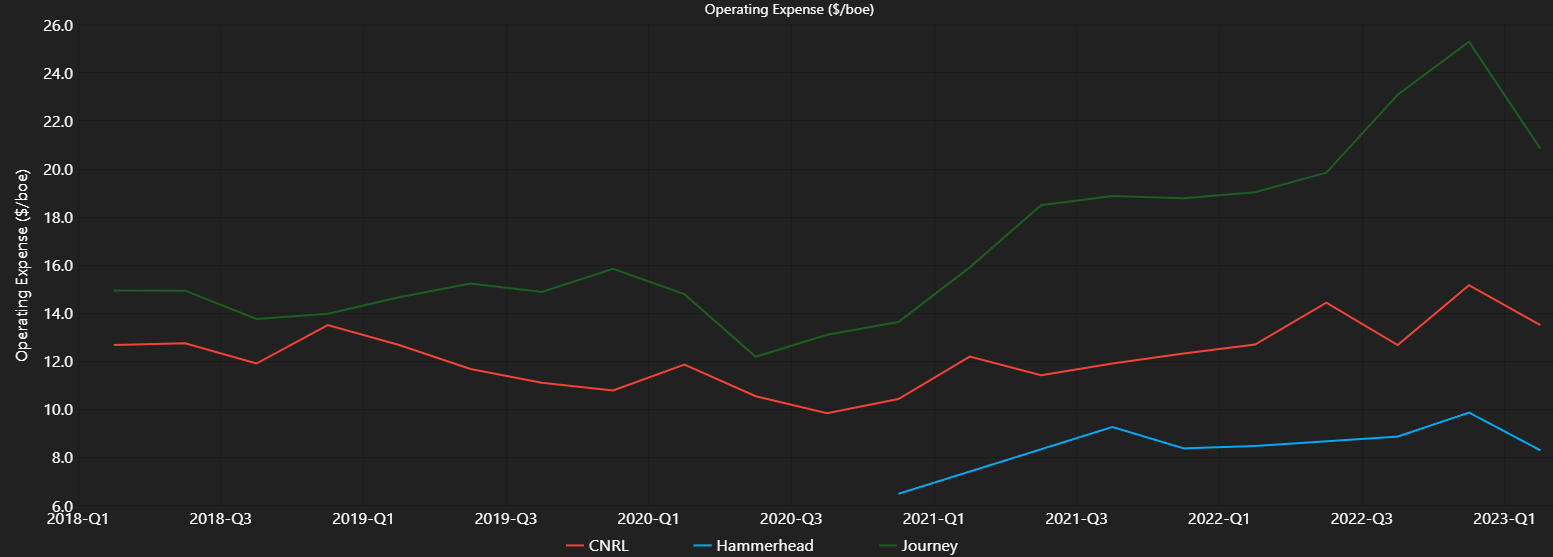
Operating costs for CNRL, Hammerhead and Journey. (Q1 2018 to Q1 2023 as available)
| Company Name | Q4 2022 ($/BOE) | Q1 2023 ($/BOE) | Absolute Change ($/BOE) | % Change |
| Journey Energy | 25.30 | 20.85 | -4.45 | -17.6 |
| Hammerhead Energy | 9.87 | 8.30 | -1.57 | -15.9 |
| Hemisphere | 13.16 | 11.08 | -2.08 | -15.8 |
| Canadian Natural Resources | 15.17 | 13.51 | -1.66 | -10.9 |
| Paramount Resources | 13.31 | 12.43 | -0.88 | -6.6 |
| Saturn | 23.53 | 21.99 | -1.55 | -6.6 |
| MEG Energy | 11.05 | 10.34 | -0.71 | -6.4 |
| Spartan Delta | 8.64 | 8.26 | -0.38 | -4.4 |
| Tamarack Valley | 10.88 | 10.49 | -0.39 | -3.6 |
| Cardinal Energy | 26.42 | 25.64 | -0.77 | -2.9 |
| Birchcliff Energy | 4.06 | 3.95 | -0.11 | -2.7 |
| Athabasca Oil | 16.73 | 16.31 | -0.42 | -2.5 |
| Pine Cliff | 13.49 | 13.18 | -0.30 | -2.3 |
| NuVista | 11.94 | 11.71 | -0.23 | -1.9 |
| Obsidian Energy | 16.43 | 16.20 | -0.24 | -1.4 |
| Whitecap Resources | 14.13 | 13.97 | -0.16 | -1.1 |
| InPlay Oil | 14.78 | 14.70 | -0.08 | -0.5 |
| Rubellite Energy | 6.11 | 6.10 | -0.01 | -0.2 |
| Advantage Energy | 3.39 | 3.44 | 0.05 | 1.5 |
| Lucero Energy | 9.32 | 9.48 | 0.16 | 1.7 |
| ROK Resources | 22.94 | 23.50 | 0.56 | 2.4 |
| ARC Resources | 4.37 | 4.50 | 0.13 | 3.0 |
| Yangarra Resources | 6.77 | 7.00 | 0.23 | 3.4 |
| Kelt Exploration | 10.90 | 11.34 | 0.44 | 4.0 |
| Gear Energy | 21.55 | 22.45 | 0.90 | 4.2 |
| Surge Energy | 22.10 | 23.06 | 0.95 | 4.3 |
| Ovintiv | 5.61 | 5.86 | 0.25 | 4.5 |
| Headwater Exploration | 6.25 | 6.53 | 0.28 | 4.5 |
| Pipestone | 12.87 | 13.49 | 0.62 | 4.8 |
| Tourmaline | 4.38 | 4.63 | 0.25 | 5.7 |
| Petrus Resources | 6.86 | 7.26 | 0.40 | 5.8 |
| Crescent Point | 14.50 | 15.35 | 0.85 | 5.9 |
| Kiwetinohk Energy | 7.20 | 7.66 | 0.46 | 6.4 |
| Enerplus | 13.08 | 14.27 | 1.19 | 9.1 |
| Baytex Energy | 13.06 | 14.40 | 1.34 | 10.3 |
| Vermilion Energy | 16.81 | 18.66 | 1.85 | 11.0 |
| Crew Energy | 3.70 | 4.18 | 0.47 | 12.7 |
| Perpetual Energy | 5.83 | 7.04 | 1.21 | 20.8 |
| Peyto Exploration | 2.44 | 3.00 | 0.56 | 23.0 |
| Pieridae Energy | 16.24 | 20.25 | 4.01 | 24.7 |
| Cenovus | 9.59 | 13.15 | 3.56 | 37.1 |
| Bonterra Energy* | 0.00 | 0.00 | 0.00 | 0.0 |
| Imperial Oil* | 0.00 | 0.00 | 0.00 | 0.0 |
| Suncor* | 0.00 | 0.00 | 0.00 | 0.0 |
| MEDIAN | 11.94 | 11.71 | -0.23 | -1.9 |
* Operating costs are unavailable for these companies. As such, they are not included in the median calculations.
Transportation Costs
Transportation costs remained elevated in Q1, in keeping with the trend observed for most of 2022. The median company saw a 3.9% increase in operating costs in Q1 2023, following on a 3.1% increase observed in Q4 2022 (see our Q4 2022 earnings season report card here). 7 companies saw transportation costs increase by more than 10%, while only 3 companies saw transportation costs decrease by more than 10%. In aggregate, 17 companies saw decreased transportation costs, while 22 companies saw increased transportation costs. This suggests that transportation cost increases are still a challenge for many producers. With respect to individual companies, InPlay Oil, NuVista, and Pieridae showed the largest improvement from last quarter. InPlay was able to reduce transportation costs by 27%. NuVista took advantage of a one-time third party credit adjustment received in Q1 2023 that contributed to a 22.5% reduction in their transportation expense burden. Pieridae benefitted from lower allocated fuel gas costs from its sales pipeline operator that helped reduce transportation costs by 12.6%.
Transportation Costs for Pieridae Energy, InPlay Oil, and NuVista. (Q1 2018 to Q1 2023)
| Company Name | Q4 2022 ($/BOE) | Q1 2023 ($/BOE) | Absolute Change ($/BOE) | % Change |
| InPlay Oil | 1.26 | 0.92 | -0.34 | -27.0 |
| NuVista | 5.33 | 4.13 | -1.20 | -22.5 |
| Pieridae | 1.83 | 1.60 | -0.23 | -12.6 |
| Crescent Point | 3.09 | 2.83 | -0.26 | -8.4 |
| Hammerhead | 6.33 | 5.84 | -0.49 | -7.7 |
| Pipestone | 3.51 | 3.26 | -0.25 | -7.1 |
| Rubellite | 8.42 | 7.92 | -0.50 | -5.9 |
| Lucero | 1.77 | 1.72 | -0.05 | -2.8 |
| Hemisphere | 2.64 | 3.21 | 0.57 | -2.6 |
| Advantage Energy | 4.43 | 4.33 | -0.10 | -2.3 |
| Perpetual | 1.86 | 1.82 | -0.04 | -2.2 |
| ARC Resources | 5.70 | 5.61 | -0.09 | -1.6 |
| Petrus Resources | 2.08 | 2.05 | -0.03 | -1.4 |
| ROK Resources | 0.97 | 1.92 | 0.95 | -1.0 |
| Obsidian Energy | 3.28 | 3.25 | -0.03 | -0.9 |
| Kelt Exploration | 3.03 | 3.01 | -0.02 | -0.7 |
| Cenovus | 8.57 | 8.52 | -0.05 | -0.6 |
| Whitecap | 2.12 | 2.13 | 0.01 | 0.5 |
| Kiwetinohk | 5.27 | 5.35 | 0.08 | 1.5 |
| Ovintiv | 11.92 | 12.18 | 0.25 | 2.1 |
| Spartan Delta | 2.76 | 2.83 | 0.07 | 2.5 |
| Pine Cliff | 1.42 | 1.47 | 0.05 | 3.5 |
| Cardinal Energy | 0.87 | 0.91 | 0.04 | 4.6 |
| Crew Energy | 3.56 | 3.74 | 0.18 | 5.1 |
| Gear Energy | 4.03 | 4.25 | 0.22 | 5.5 |
| Tourmaline | 5.08 | 5.37 | 0.29 | 5.7 |
| Canadian Natural Resources | 3.80 | 4.03 | 0.23 | 6.1 |
| Enerplus | 5.46 | 5.81 | 0.35 | 6.4 |
| Birchcliff | 4.74 | 5.07 | 0.33 | 7.0 |
| Tamarack Valley | 3.64 | 3.90 | 0.26 | 7.1 |
| Athabasca | 7.36 | 7.95 | 0.59 | 8.0 |
| Peyto | 1.35 | 1.46 | 0.11 | 8.1 |
| Yangarra | 1.22 | 1.35 | 0.13 | 10.7 |
| Vermilion | 2.71 | 3.14 | 0.43 | 15.9 |
| Baytex | 1.85 | 2.18 | 0.33 | 17.8 |
| Journey | 0.86 | 1.06 | 0.20 | 23.3 |
| Surge Energy | 1.40 | 1.79 | 0.39 | 27.9 |
| Headwater | 4.21 | 5.50 | 1.29 | 30.6 |
| Saturn | 0.45 | 1.01 | 0.56 | 124.4 |
| Paramount* | 0.00 | 0.00 | 0.00 | 0.0 |
| Bonterra Energy* | 0.00 | 0.00 | 0.00 | 0.0 |
| MEG Energy** | 0.00 | 14.88 | 14.88 | 0.0 |
| Suncor* | 0.00 | 0.00 | 0.00 | 0.0 |
| Imperial* | 0.00 | 0.00 | 0.00 | 0.0 |
| MEDIAN | 3.09 | 3.21 | 0.12 | 3.9 |
* Transportation costs are unavailable for these companies. As such, they are not included in the median calculations.
** Transportation costs were unavailable for MEG Energy in Q4 2022. As such, MEG Energy is not included in the median calculation for either quarter.
Share-based Compensation (SBC)
Share-based compensation expenses were up very slightly this quarter, with the median company realizing a $0.07/BOE increase. A general downward trend in energy company share prices reduced the fair market value of share-based compensation agreements, which impacted different producers in different ways. While some companies were able to adjust existing share-based compensation liabilities to reflect their lower value (leading to reduced SBC costs), other companies opted for cash-settling vested options (which led to increased SBC costs). Hemisphere Energy led the group with a substantial 13.52 $/BOE SBC cost decline. The company noted that relatively few options vested in Q1 2023, compared to the previous quarter which saw Hemisphere issue a significant number of options in December that vested immediately. CNRL recorded a $2.15/BOE decline that was predominantly related to changes in the fair market value of the company’s share-based compensation liability. Kiwetinohk saw the second largest decline in SBC costs, recording a $0.77/BOE decline. The company cited the impact of the graded vesting of grants with higher expensing recognized in earlier periods, as well as the decline in fair market value of cash-settled compensation plans. A quick clarifying note on Athabasca’s share-based compensation costs for Q1 2023: the $11.06/BOE cost for the quarter was related to vesting equity-settled options that were cash-settled in order to minimize share dilution in advance of potential buybacks later this year. As such, this quarter was likely a one-off for the company.
| Company Name | Q4 2022 ($/BOE) | Q1 2023 ($/BOE) | Absolute Change ($/BOE) |
| Hemisphere | 13.60 | 0.08 | -13.52 |
| Canadian Natural Resources | 2.70 | 0.55 | -2.15 |
| Kiwetinohk | 1.32 | 0.55 | -0.77 |
| Paramount | 1.47 | 0.78 | -0.70 |
| ARC Resources | 0.60 | -0.03 | -0.63 |
| NuVista | 0.82 | 0.23 | -0.59 |
| Journey | 0.87 | 0.53 | -0.34 |
| Pieridae | 0.27 | 0.00 | -0.27 |
| Tamarack Valley | 0.70 | 0.45 | -0.25 |
| Perpetual | 1.33 | 1.12 | -0.21 |
| Kelt Exploration | 0.77 | 0.65 | -0.12 |
| Peyto | 0.41 | 0.33 | -0.08 |
| Lucero | 1.40 | 1.34 | -0.06 |
| Petrus Resources | 0.52 | 0.47 | -0.05 |
| Gear Energy | 0.60 | 0.61 | 0.01 |
| Cardinal Energy | 1.09 | 1.11 | 0.02 |
| Tourmaline | 0.26 | 0.28 | 0.02 |
| InPlay Oil | 0.90 | 0.93 | 0.02 |
| Pine Cliff | 0.37 | 0.43 | 0.06 |
| Advantage Energy | 0.25 | 0.35 | 0.10 |
| Pipestone | 0.26 | 0.45 | 0.19 |
| Surge Energy | 0.60 | 0.80 | 0.20 |
| Yangarra | 0.11 | 0.40 | 0.29 |
| Crew Energy | 0.65 | 0.95 | 0.31 |
| Headwater | 0.75 | 1.06 | 0.31 |
| Bonterra Energy | 0.52 | 0.90 | 0.39 |
| Crescent Point | 0.88 | 1.40 | 0.52 |
| Saturn | 0.09 | 0.62 | 0.53 |
| Whitecap | 0.44 | 0.97 | 0.53 |
| MEG Energy | 0.99 | 1.74 | 0.75 |
| Hammerhead | 0.41 | 1.33 | 0.92 |
| Obsidian Energy | -0.28 | 0.73 | 1.00 |
| Spartan Delta | 0.51 | 1.58 | 1.07 |
| Enerplus | 0.00 | 1.15 | 1.15 |
| Vermilion | 0.69 | 3.13 | 2.44 |
| Athabasca | 1.90 | 11.06 | 9.16 |
| Baytex* | 0.00 | 0.00 | 0.00 |
| Birchcliff* | 0.00 | 0.00 | 0.00 |
| Ovintiv* | 0.00 | 0.00 | 0.00 |
| Cenovus* | 0.00 | 0.00 | 0.00 |
| Imperial* | 0.00 | 0.00 | 0.00 |
| Suncor* | 0.00 | 0.00 | 0.00 |
| Rubellite* | 0.00 | 0.00 | 0.00 |
| ROK Resources* | 0.00 | 1.20 | 0.00 |
| MEDIAN | 0.62 | 0.69 | 0.07 |
* Share-based compensation figures are unavailable for these companies. As such, they are not included in the median calculations.
Netback
Declining commodity prices meant lower netbacks across the industry. The median company in our dataset experienced a 16.6% quarter-over-quarter netback decline, and only 3 companies achieved netback growth against 35 companies with netback declines. The 3 companies with netback growth had one characteristic in common: vastly improved hedging outcomes. In fact, Ovintiv, Lucero, and Crew Energy all saw lower pre-hedging netback figures in Q1 2023 despite achieving post-hedging netback growth. It also appears that producers with a strong presence in the US achieved stronger netback outcomes; Ovintiv, Lucero, and Enerplus were in the top 4 performers by proportional netback growth. This likely indicates relative advantages in the US market in this quarter, although it’s important to remember that this could simply be a swinging of the pendulum; some US-focused companies saw netback declines in our last earnings season report card.
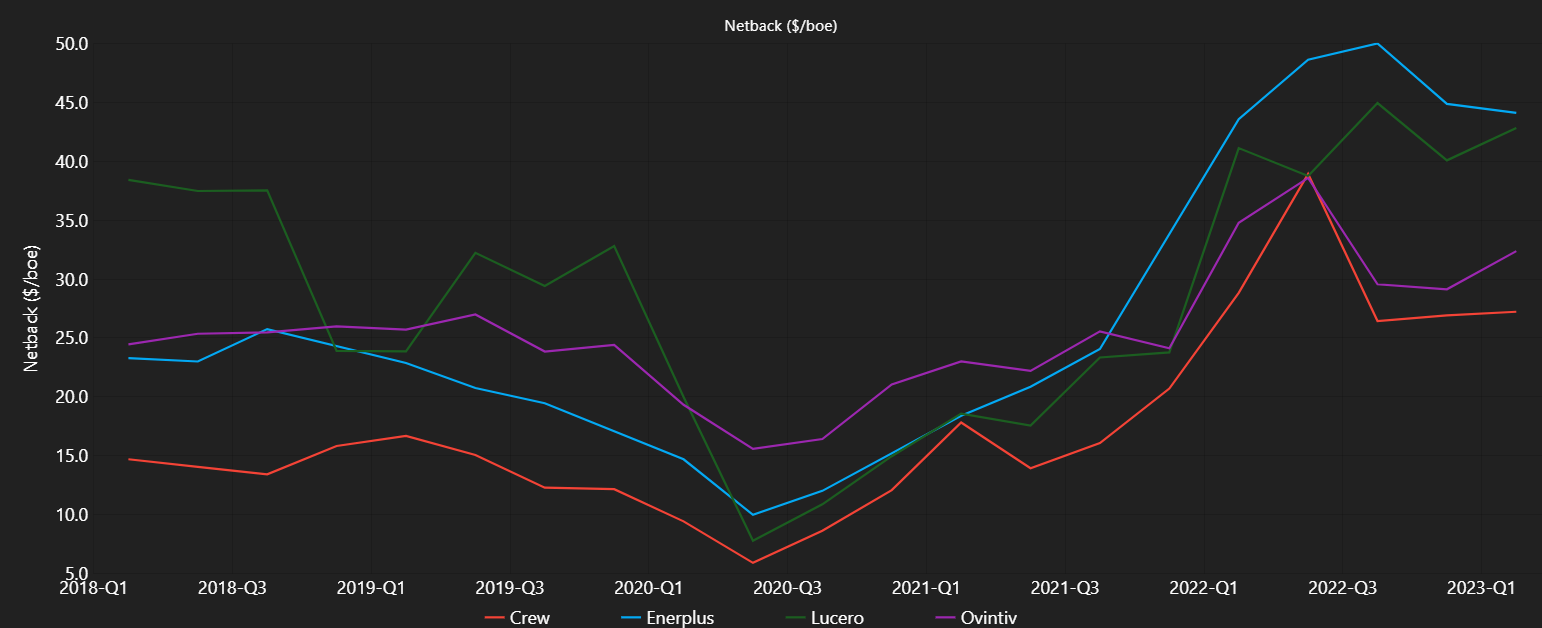
Netback for Crew, Enerplus, Ovintiv and Lucero. (Q1 2018 to Q1 2021)
| Company Name | Q4 2022 ($/BOE) | Q1 2023 ($/BOE) | Absolute Change ($/BOE) | % Change |
| Ovintiv | 29.13 | 32.36 | 3.23 | 11.1 |
| Lucero | 40.07 | 42.81 | 2.74 | 6.8 |
| Crew Energy | 26.92 | 27.22 | 0.30 | 1.1 |
| Enerplus | 44.86 | 44.09 | -0.77 | -1.7 |
| Rubellite | 46.59 | 44.35 | -2.24 | -4.8 |
| Crescent Point | 46.44 | 44.18 | -2.26 | -4.9 |
| Baytex | 38.58 | 35.65 | -2.93 | -7.6 |
| Tourmaline | 30.56 | 28.08 | -2.48 | -8.1 |
| Hemisphere | 42.62 | 38.95 | -3.67 | -8.6 |
| Hammerhead | 43.96 | 39.18 | -4.78 | -10.9 |
| Kelt Exploration | 37.49 | 33.27 | -4.22 | -11.3 |
| NuVista | 40.36 | 35.58 | -4.78 | -11.8 |
| Headwater | 50.89 | 44.60 | -6.29 | -12.4 |
| Peyto | 26.34 | 22.92 | -3.42 | -13.0 |
| Whitecap | 42.26 | 36.68 | -5.58 | -13.2 |
| Obsidian Energy | 41.21 | 35.55 | -5.66 | -13.7 |
| Pipestone | 34.58 | 29.17 | -5.41 | -15.6 |
| Kiwetinohk | 46.07 | 38.74 | -7.33 | -15.9 |
| Paramount | 38.64 | 32.26 | -6.38 | -16.5 |
| Surge Energy | 40.97 | 33.82 | -7.15 | -17.5 |
| Saturn | 56.17 | 46.14 | -10.03 | -17.9 |
| ARC Resources | 32.79 | 26.78 | -6.01 | -18.3 |
| Perpetual | 28.00 | 22.79 | -5.21 | -18.6 |
| Bonterra Energy | 42.99 | 34.90 | -8.09 | -18.8 |
| Tamarack Valley | 42.24 | 34.17 | -8.07 | -19.1 |
| Spartan Delta | 34.28 | 27.17 | -7.11 | -20.7 |
| InPlay Oil | 38.42 | 30.34 | -8.08 | -21.0 |
| Advantage Energy | 26.37 | 20.73 | -5.64 | -21.4 |
| MEG Energy | 43.89 | 34.32 | -9.57 | -21.8 |
| Cardinal Energy | 38.26 | 29.92 | -8.35 | -21.8 |
| Gear Energy | 38.21 | 29.39 | -8.82 | -23.1 |
| ROK Resources | 43.87 | 33.71 | -10.16 | -23.2 |
| Yangarra | 42.74 | 30.84 | -11.90 | -27.8 |
| Pieridae | 21.21 | 15.24 | -5.97 | -28.1 |
| Journey | 26.58 | 19.04 | -7.54 | -28.4 |
| Vermilion | 70.00 | 46.33 | -23.67 | -33.8 |
| Petrus Resources | 42.73 | 27.85 | -14.88 | -34.8 |
| Pine Cliff | 21.06 | 11.72 | -9.34 | -44.3 |
| Athabasca | 20.47 | 10.27 | -10.20 | -49.8 |
| Birchcliff | 31.92 | 15.09 | -16.83 | -52.7 |
| Cenovus* | 0.00 | 0.00 | 0.00 | 0.0 |
| Canadian Natural Resources* | 0.00 | 0.00 | 0.00 | 0.0 |
| Suncor* | 0.00 | 0.00 | 0.00 | 0.0 |
| Imperial* | 0.00 | 0.00 | 0.00 | 0.0 |
| MEDIAN | 39.36 | 32.82 | -6.54 | -16.6 |
* Post-hedging netback figures are unavailable for these companies. As such, they were left out of the median calculations.
Average Realized Price ($/BOE)
Realized prices were down across the board, largely on account of falling commodity prices. Uncertainty around the health of the US economy sparked fears of reduced oil and gas demand south of the border, which impacted markets for petroleum products across the globe. This decline was particularly pronounced in March, a month in which the WTI briefly dropped below $67 USD a barrel. With that said, realized prices declined to varying degrees among producers. Four producers saw realized price declines under 10%, an achievement when considering the fact that the median company realized a decline of more than 16%. Among the top 4 performers, 3 (Tourmaline, Pieridae, and NuVista) have high a natural gas weighting. Lucero, the top performer of all, is oily but also has most of its operations south of the border and is exposed to slightly different pricing dynamics than most of the companies in our dataset.
| Company Name | Q4 2022 ($/BOE) | Q1 2023 ($/BOE) | Absolute Change ($/BOE) | % Change |
| Lucero | 75.18 | 72.76 | -2.42 | -3.2 |
| Pieridae | 40.02 | 38.21 | -1.81 | -4.5 |
| Tourmaline | 46.24 | 42.75 | -3.49 | -7.5 |
| NuVista | 66.73 | 60.88 | -5.85 | -8.8 |
| Hemisphere | 73.16 | 65.51 | -7.65 | -10.5 |
| Rubellite | 71.42 | 63.56 | -7.86 | -11.0 |
| ROK Resources | 73.28 | 64.79 | -8.49 | -11.6 |
| Bonterra Energy | 72.39 | 63.76 | -8.63 | -11.9 |
| Surge Energy | 81.56 | 71.59 | -9.97 | -12.2 |
| Cardinal Energy | 79.11 | 69.03 | -10.08 | -12.7 |
| Whitecap | 72.94 | 63.30 | -9.64 | -13.2 |
| Peyto | 43.02 | 37.32 | -5.70 | -13.2 |
| Tamarack Valley | 71.19 | 61.61 | -9.58 | -13.5 |
| Headwater | 71.60 | 61.40 | -10.20 | -14.2 |
| Ovintiv | 64.44 | 55.09 | -9.34 | -14.5 |
| InPlay Oil | 65.69 | 55.80 | -9.89 | -15.1 |
| Saturn | 96.90 | 82.11 | -14.79 | -15.3 |
| Gear Energy | 74.19 | 62.86 | -11.33 | -15.3 |
| Kelt Exploration | 55.91 | 47.15 | -8.76 | -15.7 |
| Spartan Delta | 52.01 | 43.81 | -8.20 | -15.8 |
| MEG Energy | 69.16 | 58.18 | -10.98 | -15.9 |
| Paramount | 66.72 | 55.94 | -10.78 | -16.2 |
| Athabasca | 53.84 | 44.74 | -9.10 | -16.9 |
| Hammerhead | 73.14 | 60.31 | -12.83 | -17.5 |
| ARC Resources | 61.17 | 50.16 | -11.01 | -18.0 |
| Pipestone | 59.59 | 47.09 | -12.50 | -21.0 |
| Kiwetinohk | 70.04 | 55.30 | -14.74 | -21.0 |
| Yangarra | 55.95 | 43.91 | -12.04 | -21.5 |
| Journey | 63.82 | 50.03 | -13.79 | -21.6 |
| Crew Energy | 45.25 | 33.94 | -11.31 | -25.0 |
| Pine Cliff | 39.74 | 29.30 | -10.44 | -26.3 |
| Vermilion | 103.99 | 75.36 | -28.63 | -27.5 |
| Birchcliff | 43.63 | 31.07 | -12.56 | -28.8 |
| Petrus Resources | 57.81 | 40.16 | -17.65 | -30.5 |
| Perpetual | 43.52 | 29.90 | -13.62 | -31.3 |
| Advantage Energy | 43.66 | 27.90 | -15.76 | -36.1 |
| Baytex | 0.00 | 63.48 | 63.48 | 0.0 |
| Crescent Point | 0.00 | 72.88 | 72.88 | 0.0 |
| Enerplus | 0.00 | 63.54 | 63.54 | 0.0 |
| Obsidian Energy | 0.00 | 60.89 | 60.89 | 0.0 |
| Canadian Natural Resources | 0.00 | 0.00 | 0.00 | 0.0 |
| Cenovus | 0.00 | 0.00 | 0.00 | 0.0 |
| Imperial | 0.00 | 0.00 | 0.00 | 0.0 |
| Suncor | 0.00 | 0.00 | 0.00 | 0.0 |
| MEDIAN | 66.21 | 55.55 | -10.66 | -16.1 |
* Realized pricing figures were unavailable for these companies in Q4 2022. As such, they were left out of the median calculations.
** Realized pricing figures are unavailable for these companies. As such, they were left out of the median calculation for each quarter.
This analysis was conducted with data and tools provided by BOE Intel. For more information or to set up a demo, please contact us.
NOTE:
As many of the metrics above are non-GAAP measures, we have made attempts to standardize metrics across companies which may result in slight differences between our numbers and company disclosure.